 Finally we are in 2023! May this new year be the best one for all of you!
Before getting too far into 2023, we thought it would be interesting to look back at 2022 in data visualizations. And the first DataViz Weekly in the new year seems like a nice occasion! Let’s say farewell to 2022 by recalling its hottest topics with the help of “year in graphics” features on Politico, The Post, NYT, and Bloomberg.
2022: The Year in Figures and Charts — Politico
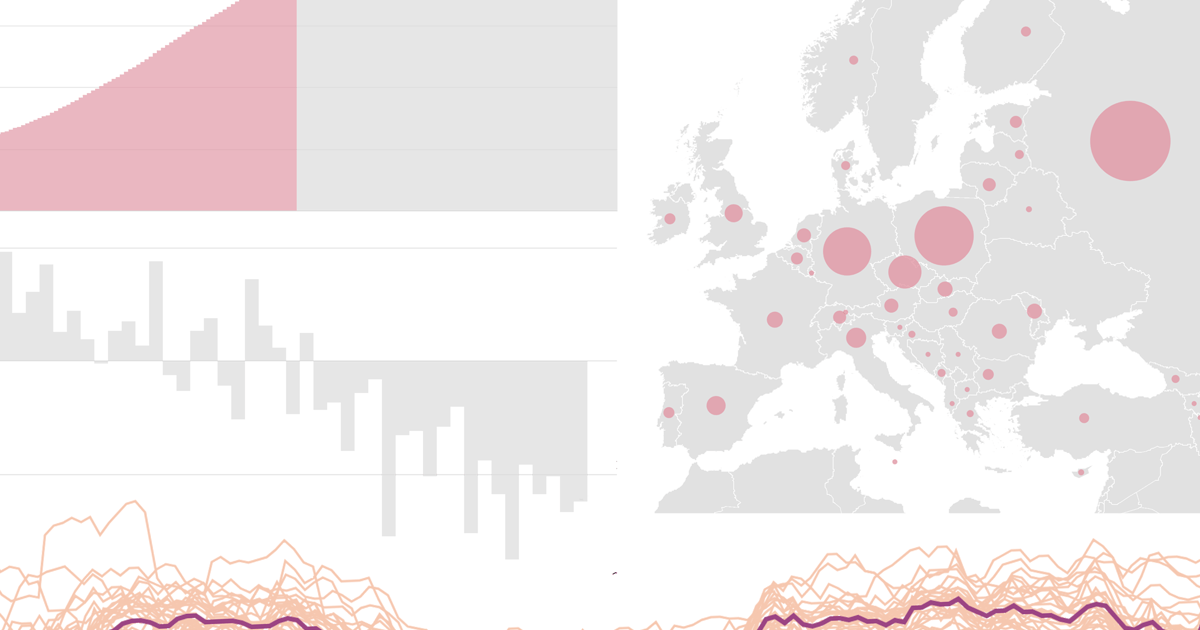
In Politico’s “year in graphics” feature, Giovanna Coi and Arnau Busquets Guàrdia list eight topics that shaped the 2022 year in Europe. Each is illustrated by one or several data visualizations that make understanding the underlying patterns and trends easy. The topics are named the following way:
- War on the continent
- Trade with Russia shrinks, but …
- Skyrocketing energy prices
- Walking right into recession
- No far-right wave in 2022
- Anarchy in the UK
- Climate change: A record Summer
- Demographic UPS and downs
2022: The Year in Graphics — The Washington Post
The Washington Post’s graphics team looks back at 2002 in the context of its own work. The journalists’ year-wrapping piece groups their visual stories published in 2022 into six sections according to what was done:
- Visualizing events as they happen
- Helping voters navigate and understand elections
- Exploring stories close to home
- Telling our readers more about themselves
- Explaining the world around us
- And getting delight from little joys along the way
See below what they’ve got for you there:
1. Visualizing events as they happen
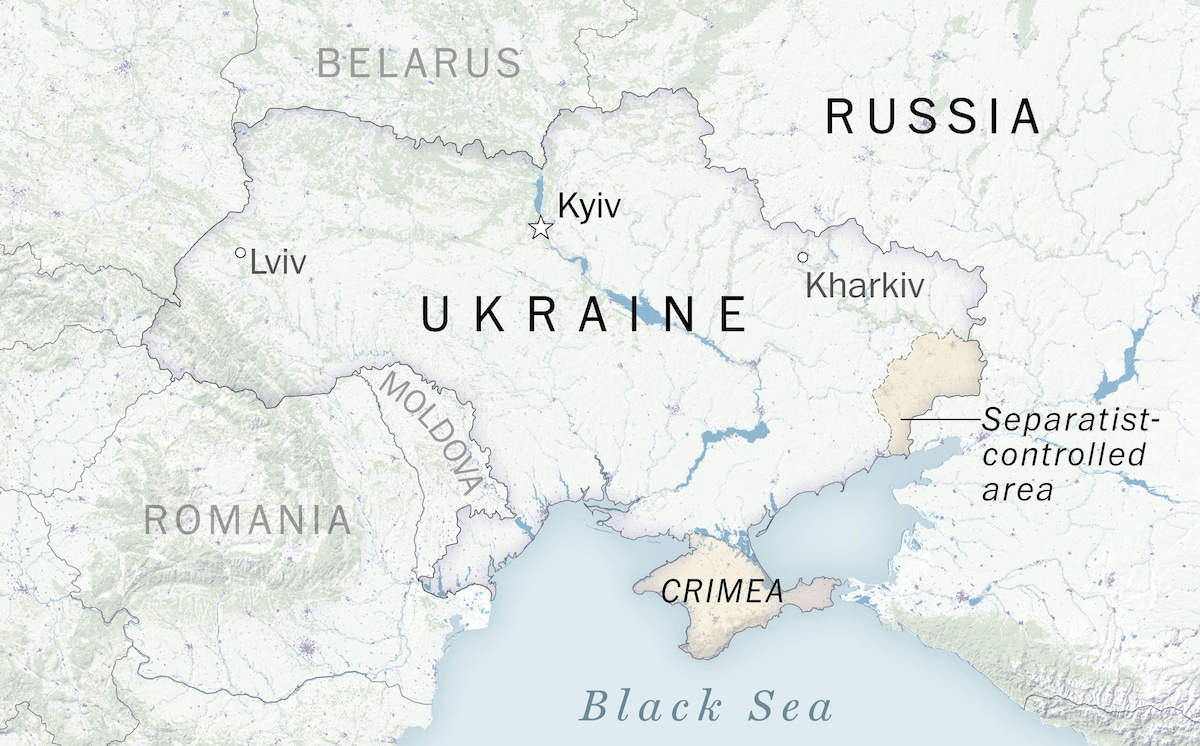
- Wetlands and radioactive soil: How Ukraine’s geography could influence a Russian invasion — by Júlia Ledur, Ruby Mellen, Laris Karklis and Mary Ilyushina
- One million lives cut short by covid-19 — by Alyssa Fowers and Leslie Shapiro
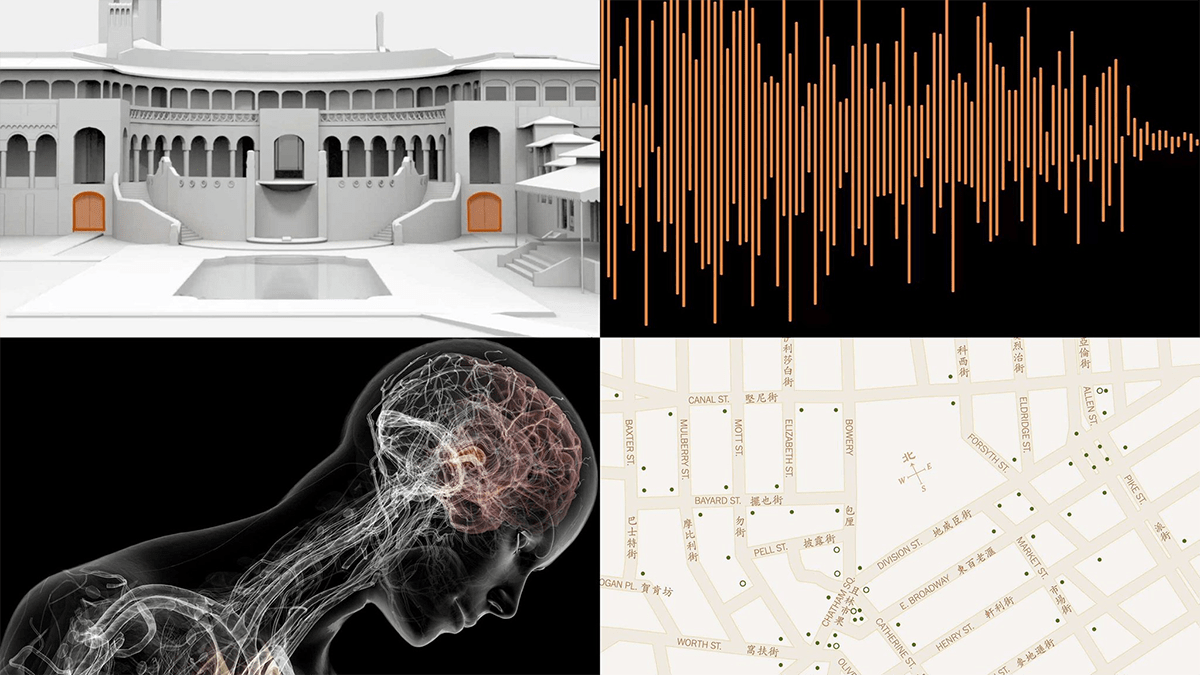
- A look inside Queen Elizabeth II’s final resting place — by Aaron Steckelberg, Manuel Canales and Ruby Mellen
- In maps, photos and videos, see the full force of Yellowstone’s floods — by N. Kirkpatrick, Jason Samenow, Dylan Moriarty and Laris Karklis
- See how lasers led to a nuclear fusion milestone — by Aaron Steckelberg, Szu Yu Chen and Joel Achenbach
- How Yuzuru Hanyu nearly landed a quadruple Axel — by Artur Galocha, Robert Samuels and Bonnie Berkowitz
- Abortion is now banned or under threat in these states — by Caroline Kitchener, Kevin Schaul, N. Kirkpatrick, Daniela Santamariña and Lauren Tierney
2. Helping voters navigate and understand elections
- Play mini golf to see how politicians tilt elections using maps — by Dylan Moriarty and Joe Fox
- Tracking which 2020 election deniers are winning, losing in the midterms — by Adrian Blanco, Daniel Wolfe and Amy Gardner
- How election modeling can help us understand who might win — by Adrian Blanco and Artur Galocha
- Here’s how abortion access fared in the midterm elections in nine states — by Caroline Kitchener, Kati Perry and Kevin Schaul
- Which congressional district am I in — by Kevin Schaul, Garland Potts and Nick Mourtoupalas
- See how Republicans won the House but fell short of a red wave — by Dan Keating, Harry Stevens and Nick Mourtoupalas
- How readers feel about the Supreme Court’s abortion ruling — by Leslie Shapiro and N. Kirkpatrick
3. Exploring stories close to home
- We built a fake metropolis to show how extreme heat could wreck cities — by Bonnie Berkowitz, Artur Galocha and Júlia Ledur
- How the NFL blocks Black coaches — by Dave Sheinin, Michael Lee, Emily Giambalvo, Artur Galocha and Clara Ence Morse
- The housing market is cooling. What’s it like in your area? — by Kevin Schaul and Hamza Shaban
- More than 1,800 congressmen once enslaved Black people. This is who they were, and how they shaped the nation — by Julie Zauzmer Weil, Adrian Blanco and Leo Dominguez
- How the Watergate scandal broke to the world: A visual timeline — by Bonnie Berkowitz and Dylan Moriarty
- See just how bad a year it was for your retirement account — and why — by Luis Melgar, David J. Lynch and Leslie Shapiro
- How it looks like as drought strangles the mighty Mississippi — by Brady Dennis, Laris Karklis, Scott Dance and Tim Meko
4. Explaining the world around us
- Devouring the rainforest — by Terrence McCoy and Júlia Ledur
- Why Russia gave upon urban war in Kyiv and turned to big battles in the east — by Aaron Steckelberg, Adam Taylor, Ruby Mellen, Alex Horton and Dylan Moriarty
- The ‘deglobalization’ of Moscow — by Ruby Mellen, Maite Fernández Simon, Júlia Ledur and Yutao Chen
- What bodybuilders do to their bodies — and brains — by Bonnie Berkowitz and William Neff
- The unique ways Filipinos are protecting their homes against floods — by Regine Cabato, William Neff and Hannah Dormido
- You’re one in 8 billion — by Daniel Wolfe, Ruby Mellen, Leslie Shapiro and Hailey Haymond
- The gold-mining city that is destroying a sacred Venezuelan mountain — by Samantha Schmidt, Ana Vanessa Herrero and Janice Kai Chen
5. Telling our readers more about themselves
- Am I eligible for Biden’s student loan forgiveness plan? Try this tool — by Dylan Moriarty and Alyssa Fowers
- Is it time to upgrade your smartphone? Our quiz can help you decide — by Heather Kelly, Chris Alcantara and Chris Velazco
- Coffee vs. tea smackdown — by Anahad O’Connor, Aaron Steckelberg and Garland Potts
- How permanent daylight saving time would change sunrise and sunset times — by Justin Grieser, Joe Fox and Tim Meko
- You may have hearing loss and not know it. Here’s what it sounds like — by Amanda Morris and Aaron Steckelberg
6. And getting delight from little joys along the way
- The most popular people names for dogs — by Alyssa Fowers and Chris Alcantara
- That’s a clear offside! But why? — by Artur Galocha
- See how much snow your hometown gets for the holidays — by Dylan Moriarty
- Craving brains and hangry: Zombie behavior demystified by scientists — by Bonnie Berkowitz and Shelly Tan
- AI can now create images out of thin air. See how it works — by Kevin Schaul, Hamza Shaban, Shelly Tan, Monique Woo and Nitasha Tiku
2022: The Year in Visual Stories and Graphics — The New York Times
For The New York Times, Eleanor Lutz and Ege Uz put together all visual storytelling articles published by the outlet in a month-by-month summary. By glancing at the images and titles as you scroll, you can reveal the entire timeline of the year in the news (and opinions) graphics.
January:
- Early data hints at omicron’s potential toll across America
- A vivid view of extreme weather: Temperature records in the U.S. in 2021
- How oath keepers are accused of plotting to storm the capitol
- How Russia’s military is currently positioned
- You can’t judge a district just by looking at it
- The women who had abortions before Roe v. Wade
- Can you gerrymander your party to power?
February:
- How the quad jump is changing women’s figure skating
- Escalating tricks, escalating fears
- What scares the world’s most daring Olympians
- See the jumps, twists and grabs that brought Eileen GU three Olympic medals
- How Nathan Chen won gold in men’s figure skating
- See how Ayumu Hirano made Olympic history in halfpipe to win gold
- Maps: Tracking the Russian invasion of Ukraine
- Social media coverage of the Beijing Olympics
- The hidden image descriptions making the internet accessible
- How a book is made
- How long COVID exhausts the body
- Moments from the Beijing Winter Games, frame by frame
- Meet peat, the unsung hero of carbon capture
- What it’s like to ski nearly blind
- How much snow will fall where you live?
- Who’s requiring workers to be vaccinated?
- Four charts that reveal Tom Brady’s greatness
March:
- Russia’s attacks on civilian targets have obliterated everyday life in Ukraine
- This map shows where biodiversity is most at risk in America
- A poem (and a painting) about the suffering that hides in plain sight
- Manhattan’s Chinese street signs are disappearing
April:
- Inside the apocalyptic worldview of ‘Tucker Carlson Tonight’
- How Kyiv has withstood Russia’s attacks
- Wordlebot: Improve your wordle strategy
- ‘It’s super spectacular.’ see how the Tonga volcano unleashed a once-in-a-century shockwave.
- Trash or recycling? Why plastic keeps us guessing.
- Under lockdown in China
May:
- How formula 1’s car redesign is changing racing
- What’s your rate of inflation?
- Haiti’s lost billions
- 788 long minutes
- George Floyd and the fading signs of black lives matter
- Where death rates rose the most during the pandemic
- How America lost one million people
- From Italy to Croatia on two wheels
- Russia’s shrinking war
- Tracking the states where abortion is now banned
June:
- How abortion bans will ripple across America
- The secret pentagon photos of the first prisoners at guantánamo bay
- Who will remember the horrors of Ukraine?
- See the black family heirlooms that carry history
- How the proud boys breached the capitol on Jan. 6: Rile up the normies
- China’s surveillance state is growing. These documents reveal how.
- The new geography of the Russian elite
- They searched online for abortion clinics. They found anti-abortion centers.
- The mass shootings where stricter gun laws might have made a difference
- Anatomy of a product placement
- Who stops a ‘bad guy with a gun’?
- The Dobbs v. Jackson decision, annotated
- What hundreds of photos of weapons reveal about Russia’s brutal war strategy
July:
- Tracking dangerous heat in the U.S.
- Why so Many children of immigrants rise to the top
- Meryl Streep’s one weird trick
- This 500-year-old tree in California has a story to tell
- How sign language evolves as our world does
- Powwow season in full bloom
- The chain of failures that left 17 dead in a Bronx apartment fire
August:
- Vast new study shows a key to reducing poverty: More friendships between rich and poor
- How China could choke Taiwan
- The coming California megastorm
- The illegal airstrips bringing toxic mining to Brazil’s indigenous land
- How 3 NASA missions could send astronauts back to the moon
- Can Anacostia build a bridge without displacing its people?
- That dinner tab has soared. Here are all the reasons.
- What’s actually being taught in history class
- The rise of the worker productivity score
- The tennis ball toss
- Maps: Tracking tensions between China and Taiwan
September:
- What the F.B.I. seized from Mar-a-Lago, illustrated
- Europe is sacrificing its ancient forests for energy
- The elusive future of San Francisco’s fog
- How China targets the global fish supply
- Stock trades reported by nearly a fifth of congress show possible conflicts
- ‘They are watching’: Inside Russia’s vast surveillance state
- Mr. Biden, tear down this highway
- Fire and fear in south Ukraine
- Can brown noise turn off your brain?
- ‘Putin is a fool’: Intercepted calls reveal Russian army in disarray
- What it costs to get an abortion now
October:
- The monsoon is becoming more extreme
- Wow moments: Highlights and surprises from fashion week
- Over 370 republican candidates have cast doubt on the 2020 election
- Abortions are legal in Ethiopia. But half of these clinics won’t provide them.
- See everything the white house wanted, and everything it got
- What hurricane Ian destroyed in a Florida beach town
- Hey, New Yorkers: Meet your neighborhood’s new congressional district
- How Xi Jinping remade China in his image
- You be the ump
- 50 years ago, Stevie Wonder heard the future
- What happened to HU jintao?
- Science has a nasty photoshopping problem
- The portrait of justice
November:
- The visions of Octavia Butler
- It took two weeks to call every state in 2020. This is when to expect results this year.
- 2022 midterm election results
- How news about Maricopa county’s ballot-counting machines went viral
- See which 2020 election deniers and skeptics won and lost in the midterm elections
- American rituals
- Extreme heat will change us
- The anatomy of a panic attack
- How republicans won the house
- What it really takes to breastfeed a baby
- What riding in a self-driving Tesla tells us about the future of autonomy
- How Ukraine blew up a key Russian bridge
- A mystery hidden in a family photograph
- World cup 2022: How teams can advance to the round of 16
- Watch Christian Pulisic send the U.S past Iran and into the knockout rounds
December:
- These Georgia precincts were red. Then blue. Now they are purple.
- What makes a movie the greatest of all time?
- Spot the ball
- If you want to give something back to nature, give your body
- Caught on camera, traced by phone: The Russian military unit that killed dozens in Bucha
- Animals are running out of places to live
- Inside Mar-a-Lago, where thousands partied near secret files
- North Korea wants dollars. It’s a sign of trouble.
- The climate impact of your neighborhood, mapped
- Defenses carved into the earth
- Putin’s war: The inside story of a catastrophe
- How bots pushing adult content drowned out Chinese protest tweets
- The Tom Brady of other jobs
2022 in Data and Graphics — Bloomberg
Bloomberg’s data visualization team shows how its members used charts and maps to communicate the most important figures and stories of 2022 in an interactive “year in graphics” compilation. All their projects are grouped by month. Text captions attached to some of them highlight the key issues and revelations.
It would be hard to list them all here. We totally leave it to you to explore Bloomberg’s “year in graphics” roundup. 😉
***
If you want to see more, check out the “year in graphics” features by Atlo, Axios, FiveThirtyEight, McKinsey, Scientific American, USA TODAY, The Wall Street Journal, Vox, ZEIT ONLINE.
You are also more than welcome to look at our previous year roundups — 2021, 2020, 2019, 2018 — and weekly selections of the most interesting data visualizations.
Have a wonderful year!
- Categories: Data Visualization Weekly
- No Comments »