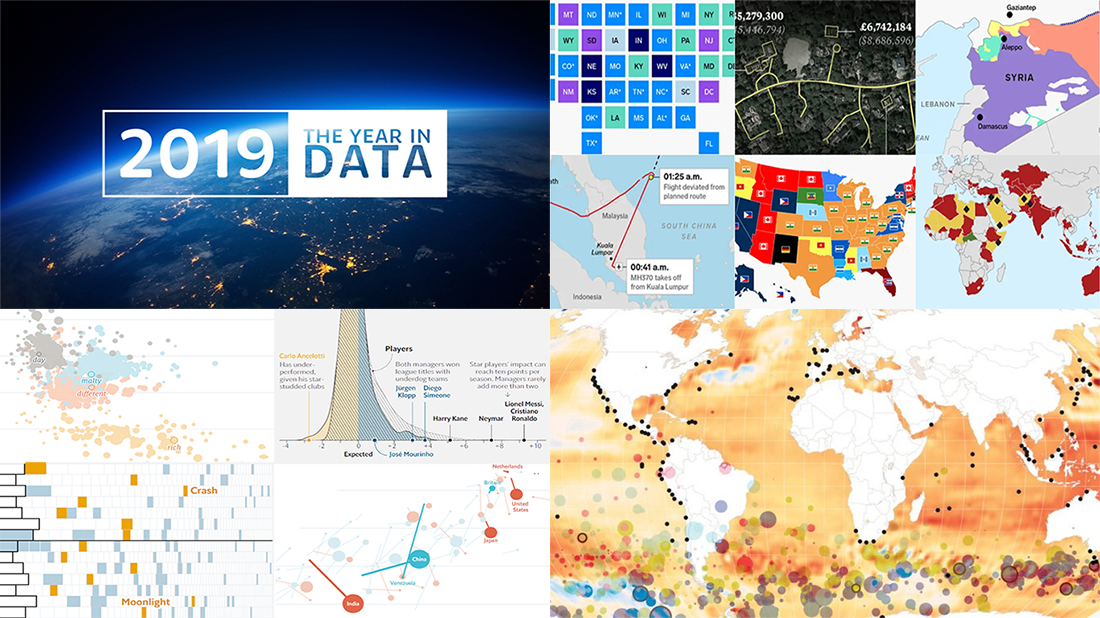
 Happy New Year everyone! Now that 2020 is finally here, let’s hold on just one moment to take a look back at 2019. In the first DataViz Weekly post of this new year, we highlight four cool “Year in Charts” stories from the World Bank, The Economist, Financial Times, and Business Insider. Check them out to remember what 2019 was like.
Year in Charts — 2019 Review in Data Visualization Weekly
World Bank’s 14 Charts

The World Bank selected 14 charts to highlight “some remarkable achievements and the serious challenges that remain as we head into 2020,” which visualize data on the following subjects:
- Poverty (several aspects)
- Carbon pricing initiatives
- Access to electricity
- Extinction of species
- Birth registration
- Literacy
- Employment patterns
- Debt
- Refugee numbers
- Remittances
- Mobile phones and internet access
- Measles
Financial Times’ 10 Charts
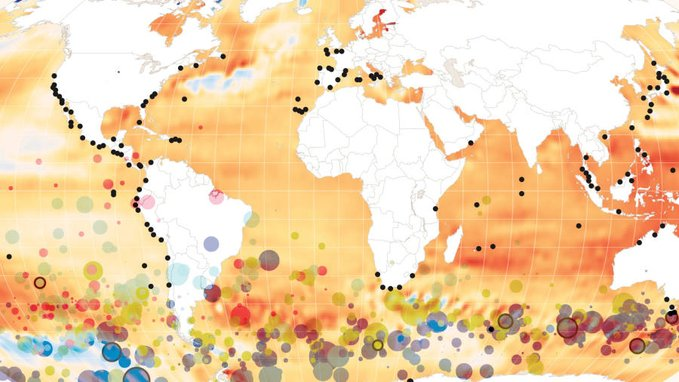
The Financial Times picked 10 graphics “where the real story is often about what happens next — in the years, decades and centuries to follow.” Those are about the following:
- Brexit
- Global health
- Automation
- Environment
- Climate change
- Lunar missions
- Privacy
- U.S.-China trade war
- U.S. election
- World magnetic model
The Economist’s 4 Charts
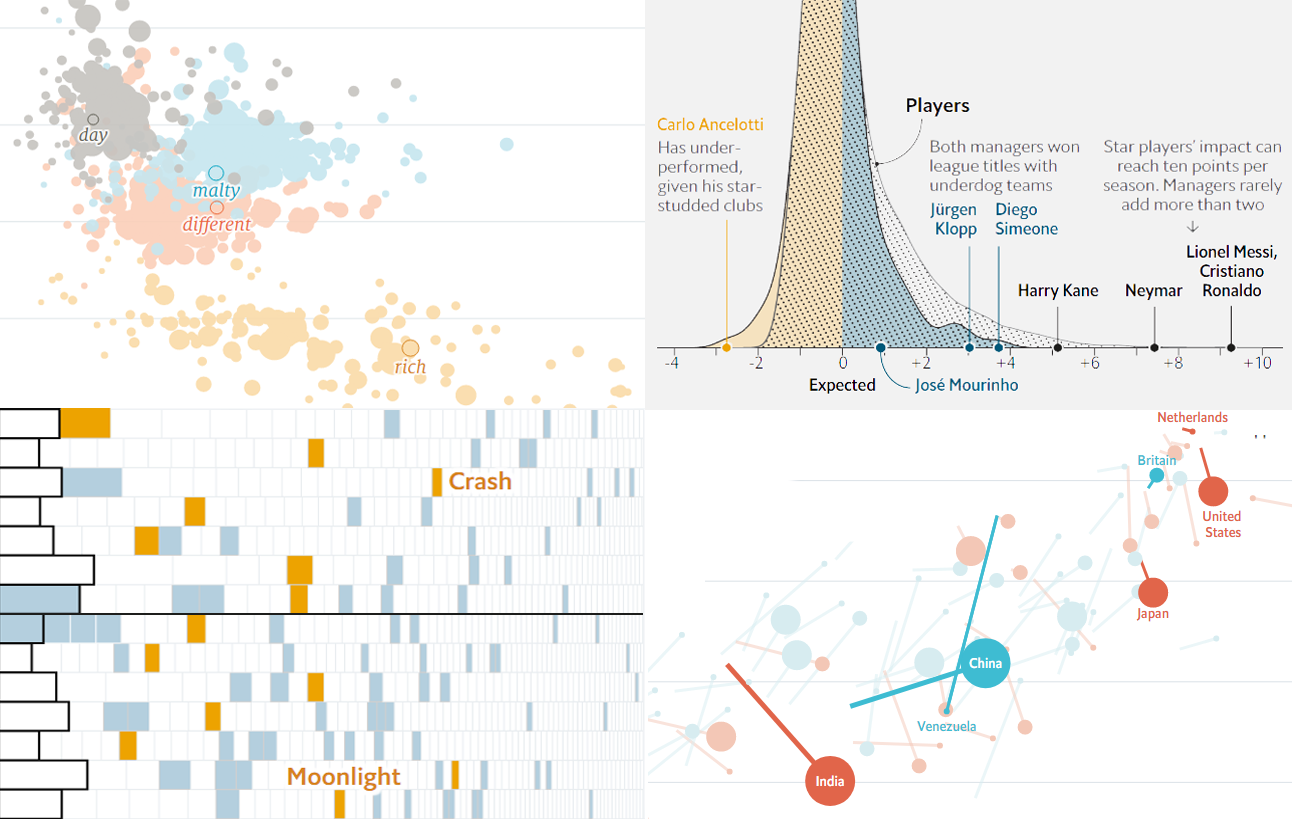
The Economist shared a small but nevertheless cool selection of charts that they titled “The sedentary pursuit of happiness” putting the following four subjects into focus:
- European football
- TV and films
- Alcohol
- Life satisfaction
Business Insider’s 36 Maps
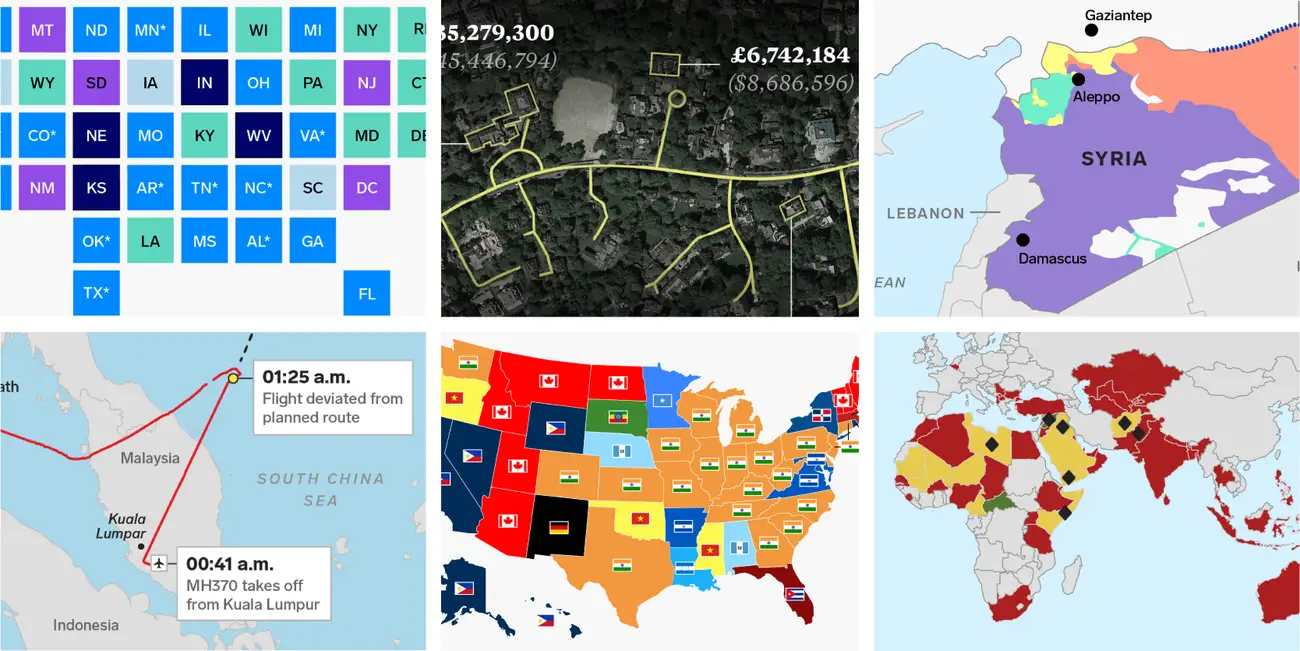
Business Insider published 36 maps created by its graphics team last year, which can tell us a lot about the ups and downs of 2019, mostly for the United States but not only. Here’s are the topics covered in those visualizations:
- Criminal disenfranchisement
- Counter-terrorism activities
- Government shutdown
- U.S.-Canada border
- Transgender military bans
- Vaccine exemptions
- China’s Belt and Road Initiative
- Retail jobs
- Boeing 737 Max bans and groundings
- Car insurance
- Tax refunds
- Kidnapping risks
- Countries of birth for foreign-born residents
- Costco’s food court menu
- Fortune 1000
- Refugee origin and host countries
- Malaysia Airlines Flight MH370
- Legality of same-sex activity
- U.S. tourists’ deaths on vacation in the Dominican Republic
- Nuclear weapons
- ICE detention centers
- Astronauts’ birth places
- Chronic wasting disease
- Meat and dairy labeling laws
- Gender pay gap
- The Hamptons
- Fall temperatures
- Donald Trump’s personal real estate
- Abortion rights
- Jeffrey Epstein’s flight
- Areas groups control in Syria and Turkey
- London’s Billionaires Row
- Vaping-related deaths
- Legality of marijuana
- Export trade partners of the U.S. states
- Primary election
***
In the new year, we will keep publishing DataViz Weekly every Friday, continuing to show you some of the most interesting charts, maps, and infographics from around the web as good examples of the data visualization in action. Stay tuned.
Happy New Year! May your dreams come true in 2020!
- Categories: Data Visualization Weekly
- 1 Comment »