 2020 was strange. It was difficult. But it was. Happy New Year everyone! ?
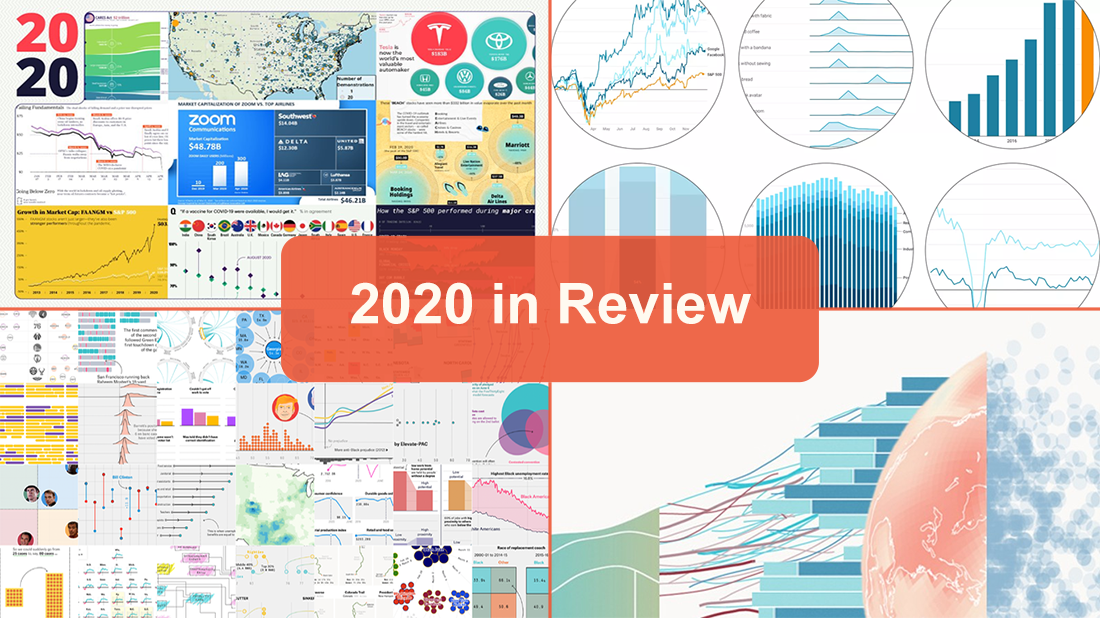
Even though 2020 was not that bad in everything, we all hope, of course, that 2021 will be (much) better. Let it be so! But before we dive into the new one, let’s take a glance back and remember 2020 as is, with the help of great data visualizations.
The January 1st issue of DataViz Weekly invites you to look through the lists of the charts included in the year-in-review features on Visual Capitalist, Recode by Vox, FiveThirtyEight, and The Economist. Sneak a peek, and then check out the graphics.
Data Visualization Weekly: December 25, 2020 — January 1, 2021
Visual Capitalist: 20 Charts
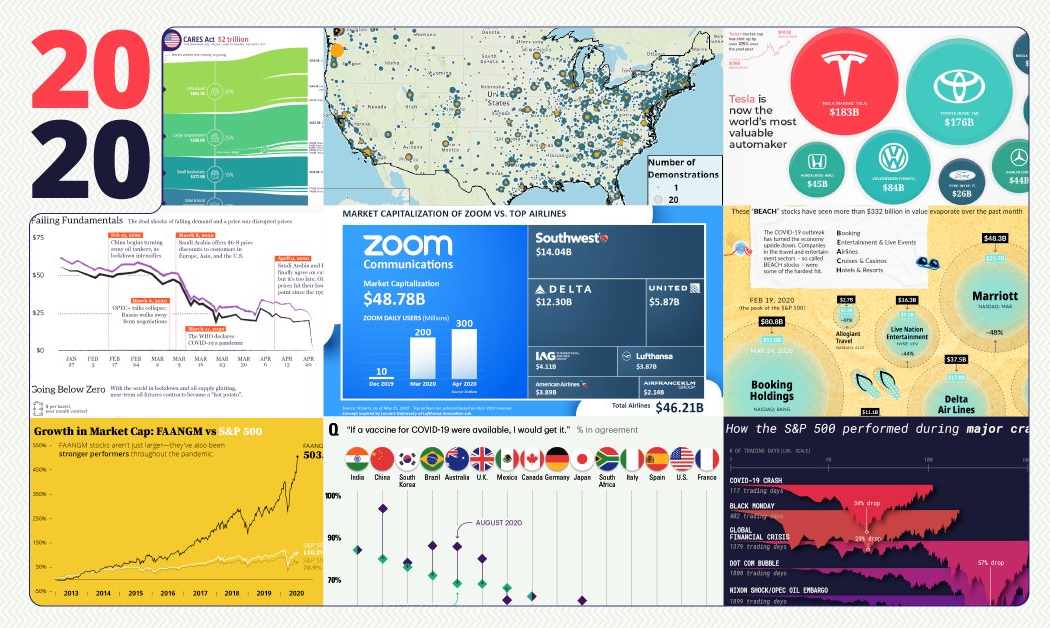
Visual Capitalist offers a look at the top events of the year in its own and third-party graphics. The data visualizations included in the year review are on the following:
- Bushfires in Australia
- Rising tensions between the United States and Iran
- Rapid spread of the novel coronavirus
- Shrinking BEACH stock market capitalization
- Start of the lockdown life
- Flattening the curve
- Historic job losses
- Stimulus
- Negative oil prices
- Black Lives Matter protests
- Zoom’s skyrocketing market capitalization
- Remote working benefits and challenges
- Tesla as the world’s most valuable automaker
- Big Tech’s dominance
- Beirut explosion
- End of the shortest bear market in history
- Wildfire season in America
- U.S. election
- COVID-19’s third wave
- Global vaccination effort’s kick-off
Recode by Vox: 20 Charts
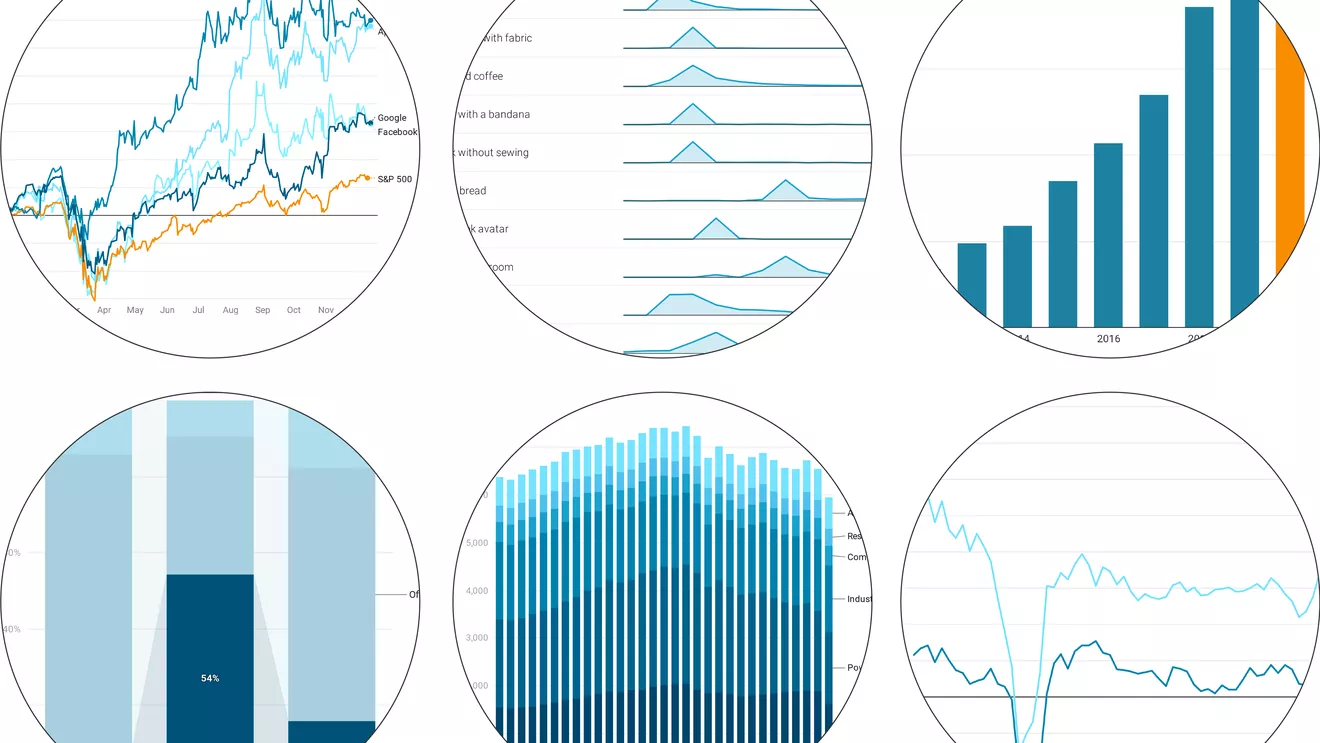
Recode‘s year-in-review roundup also comprises twenty charts. Some of them are interactive. Designed to highlight the key trends for 2020, these data visualizations are on the following:
- COVID cases worldwide
- Efforts to flatten the curve
- Vaccine development timing
- Voter turnout in the U.S. elections
- Protests
- Political stress indicator
- Google searches for food pantries
- Profits vs wage growth for essential businesses
- The highest unemployment rate in generations
- Working from home
- Shelter adoption rates for dogs and cats
- Top trending “how to make” searches on Google
- Big Tech companies’ stock price change
- Amazon’s profits
- E-commerce gains
- Amazon as a (growing) risk factor for competitors
- Growth of video streaming
- The pandemic’s effect on industries
- Greenhouse gas emissions
- Record hurricane and wildfire seasons
FiveThirtyEight: 40 Charts
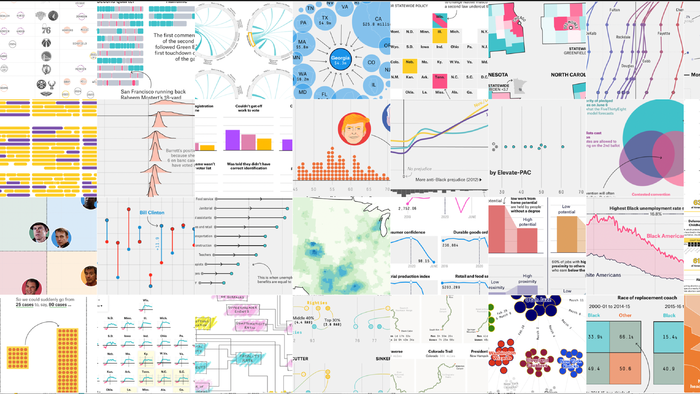
FiveThirtyEight, famous for the great use of statistical analysis to tell stories, recaps the year in a selection of forty charts called by its visual journalists as “the best — and the weirdest.” The graphics are grouped into four key topics: politics, election, sports, and Covid. Here’s a quick list of what’s presented in the year review feature on FiveThirtyEight:
Politics:
- Mail and shipping volumes
- Anti-Black prejudice by voting intention
- Supreme Court rulings vs public opinion
- Suburbs by change in diversity
- Timeline of vote tallies after polls closed, by state
- Sanders’s vote share by age and ideology
- Ideologies of Supreme Court justices since Roberts joined the court
- Party control of redistricting after the 2020 election
- How statistics may obscure bias in policing
- How favorability ratings of politicians are related
- Donations sent to Democratic candidates in Georgia via ActBlue
- Difference between Biden’s and the Democratic Senate candidates’ vote share
- Atlanta’s shift left turning Georgia blue
- Biden’s national polling margins vs Clinton’s
- Women and men holding the 25 key offices under every U.S. president since 1977
- Ideological positions of each judge on the 7th U.S. Circuit Court of Appeals
Election 2020:
- Types of barriers to voting
- Major-party presidential nominees by age since 1796
- Nonincumbent Republican women’s chances of winning the Congress seats they were running for
- Scenarios for a contested convention where no candidate receives a majority of pledged delegates
- Trump’s gains in heavily Latino counties
- National polling averages for the past 14 presidential election cycles
Sports:
- Oklahoma City Thunder offseason trades
- Every minute of the Fox television broadcast of an NFL game
- Statewise policies on the use of Native American mascots
- Football coaches in movies
- Mascots for all NBA, WNBA, NHL, MLB, and NFL teams by type
- Pitch velocity by handedness
- Classic routes targeted for FKTs
- Teams that shared arenas with the Utah Jazz and with teams that faced it
- Race of replaced and replacement NBA coaches
- Share of NFL coaches by age and by job
COVID-19 (and its economic fallout):
- Unemployment benefits vs lost earnings
- Demand at COVID-19 testing sites
- Economic indicators
- High-risk jobs vs degree and income
- Unemployment rates by race
- Transmission rates on Thanksgiving
- Share of the population that stayed at home in each state
- COVID-19 model
The Economist: Non-Covid Charts (+ All Others)

Tired of COVID and related data visualizations? Want something quite completely different? Check out The Economist. Its data journalists have curated their favorite non-COVID pieces of 2020. At the time of writing, there are five (but check now as some more should already be there):
- Hours played a game vs well-being
- Land-surface and ocean-surface temperature change
- Formula 1’s best drivers
- Household income vs maths test scores
- Distribution of songs streamed on Spotify, by mood
But if you want more, they have also collated absolutely all data visuals published in the Graphic Detail section of The Economist this year into a single PDF file.
***
Thank you for being with us! We wish you all the best in the new year!
- Categories: Data Visualization Weekly
- 1 Comment »