 Welcome to this tutorial on creating a visually stunning and interactive 3D surface plot using JavaScript! If you’re passionate about data visualization and want to expand your skills to the next level, this guide is for you. Here, we’ll take you through a step-by-step process to create an engaging 3D surface plot that will make your data come alive.
Sometimes, representing complex information using traditional 2D charts can be difficult, especially when working with large datasets or data that varies over three or more dimensions. This is where a 3D surface plot (or surface chart) can prove to be useful. In this tutorial, we’ll be using real-world population data to create our surface plot, showcasing the population growth trends of the top 50 most populous countries in the world. You don’t need to be a data expert to follow this guide, as we’ll cover everything in detail.
So, sit back, grab your favorite beverage, and let’s dive into the world of data visualization with a 3D surface plot. By the end of this tutorial, you’ll have an impressive chart that you can showcase to your colleagues or friends. Let’s get started!
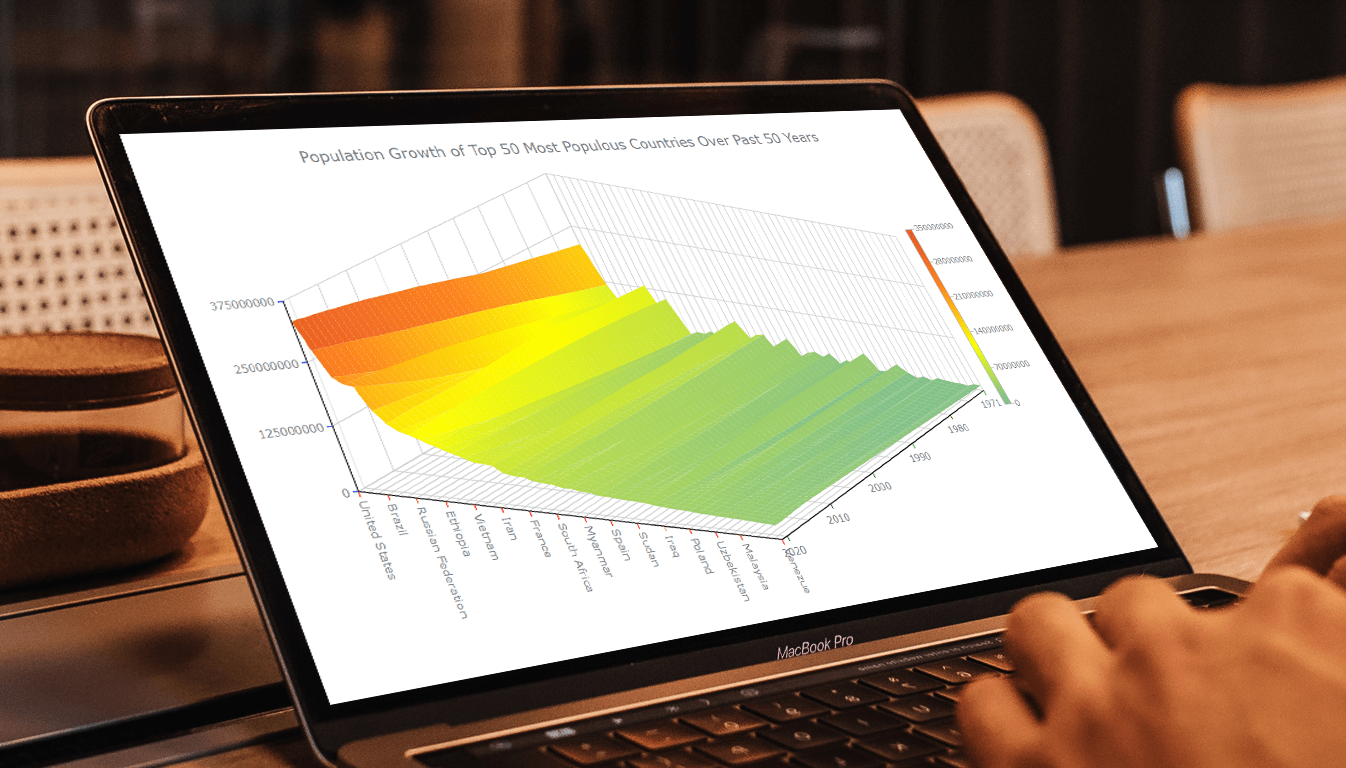
3D Surface Plot That Will Be Created
In this tutorial, I will guide you through creating a beautiful custom 3D surface plot using JavaScript. By following the step-by-step instructions will give you the skills to build your own visually stunning charts. The result will be an impressive surface chart that you can use to showcase your data meaningfully.
Look at the example chart below to see what you’ll be creating by the end of this tutorial. So let’s get started and create something amazing together!
A. How to Create Basic JS 3D Surface Plot
Creating a custom 3D surface plot in JavaScript is easier than you might think! It involves the following four fundamental steps:
- Create a basic webpage in HTML
- Include the required JavaScript files
- Add the data
- Write a simple JS charting code
And voila! You’ll have a stunning surface chart. Let’s dive deeper into each of these steps.
1. Create a basic webpage in HTML
First, we need to whip up a simple HTML webpage. Then, we add a <div> element and assign it a unique ID to create a special spot for our 3D surface plot to shine. To make sure the chart fills the entire page, we include CSS code within the <style> tag with the width and height set to 100%. Of course, you can always customize the size and shape of your chart to your heart’s content.
<!DOCTYPE html>
<html lang="en">
  <head>
    <meta charset="utf-8">
    <title>JavaScript 3D Surface Plot</title>
    <style type="text/css">
      html, body, #container {
        width: 100%;
        height: 100%;
        margin: 0;
        padding: 0;
      }
    </style>
  </head>
  <body>
    <div id="container"></div>
  </body>
</html>
2. Include the required JavaScript files
Now, we’ll add the necessary JavaScript files in the <head> section. Luckily, many charting libraries are available that simplify the process of visualizing data. I personally love AnyChart, as it supports 3D surface plots with its comprehensive documentation and is free for non-profit use. Regardless of which library you choose, the basic steps for chart creation remain the same. For the 3D surface plot, we need to include the Core, Surface, and Data Adapter modules in your project.
<!DOCTYPE html>
<html lang="en">
  <head>
    <meta charset="utf-8">
    <title>JavaScript 3D surface plot</title>
    <script src="https://cdn.anychart.com/releases/8.11.0/js/anychart-core.min.js"></script>
    <script src="https://cdn.anychart.com/releases/8.11.0/js/anychart-surface.min.js"></script>
    <script src="https://cdn.anychart.com/releases/8.11.0/js/anychart-data-adapter.min.js"></script>
    <style type="text/css">
      html, body, #container {
        width: 100%;
        height: 100%;
        margin: 0;
        padding: 0;
      }
    </style>
  </head>
  <body>
    <div id="container"></div>
    <script>
      // All the code for the 3D surface plot will come here.
    </script>
  </body>
</html>
3. Add the data
For this chart, we’ll be using data from The World Bank.
I’ve already saved the data in a JSON file, which you can find here. However, I’ve excluded the data of China and India since their large populations skew the chart data.
To load the data into our surface chart, we’ll use the anychart.data.loadJsonFile() function. Here’s the code we’ll be using.
anychart.data.loadJsonFile('https://gist.githubusercontent.com/awanshrestha/9d0f4c864817d5ee043126f63f1f4d02/raw/91cb71ac4159ce86bbe2eb204c190f1e9ce43ba6/surface-test.json',);4. Write a simple JS charting code
Creating a 3D surface plot is simpler than you might think. With just a few lines of code, you can build your chart in no time when using a good JavaScript charting library. Start by enclosing all the necessary code within an anychart.onDocumentReady() function, which ensures that it will only execute once the page is fully loaded.
<script>
  anychart.onDocumentReady(function () {
    // The JS 3D surface plot data and code will be in this section.
  });
</script>
We’ll add the data from Step 3 and create a dataset result. Then, we’ll use the anychart.data.loadJsonFile() method to load the JSON data from the file and execute a callback function when the data is available. The function (data) { } is the callback function that takes the loaded JSON data as its parameter and processes it into a format that the surface chart can understand.
Next, we’ll pass the result as a parameter to the anychart.surface() function to create a 3D surface plot object. This object can be customized and displayed on the page using JavaScript.
<script>
  anychart.onDocumentReady(function () {
    anychart.data.loadJsonFile('https://gist.githubusercontent.com/awanshrestha/9d0f4c864817d5ee043126f63f1f4d02/raw/91cb71ac4159ce86bbe2eb204c190f1e9ce43ba6/surface-test.json',
      function (data) {
        // pre-processing of the data
        var result = [];
        for (var x = 0; x < data.x.length; x++) {
          for (var y = 0; y < data.y.length; y++) {
            result.push([x, data.y[y], data.z[x][y]]);
          }
        }
      }
    );
  });
</script>
We’ll use the surface() function to create our chart, passing the result dataset into it.
var chart = anychart.surface(result);The labels of all axes are enabled by default and can be formatted using the format() parameter of the labels() method.
chart
  .xAxis()
  .labels()
  .format(function () {
    return data.x[Math.round(this.value)];
  });
We can set the axis scale using the appropriate constructor, as shown in the code snippet.
chart.xScale().maximum(data.x.length - 1);We’ll also set the chart paddings using the padding() function.
chart.padding(50, 50, 50, 75);Additionally, we can rotate the 3D surface plot by dragging it with the help of a mouse. We can even set the angles of rotation using rotationY() and rotationZ() methods.
// set the default chart rotation by the y-axis
chart.rotationY(40);

// set the default chart rotation by the z-axis
chart.rotationZ(130);
Finally, we’ll set the title of the chart and place it into the <div> container that was previously specified. We’ll display it by using the draw() function.
// set the chart title
chart.title('Population Growth of Top 50 Most Populous Countries Over Past 50 Years');
// set the container id for the chart
chart.container('container');
// initiate the visualization
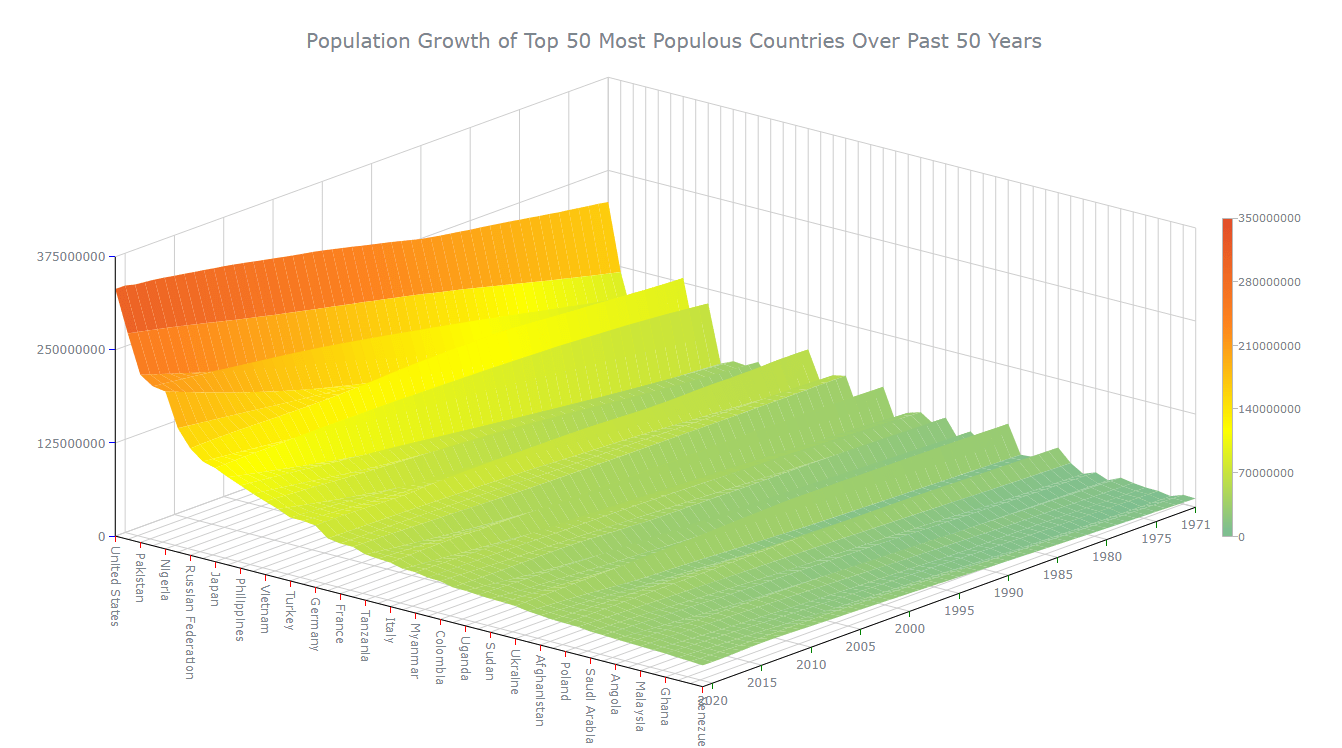
chart.draw();Ta-da! Our 3D surface plot is complete and can be seen below. For your convenience, I’ve included the complete code just under the picture. If you want to experiment with the code and see how different modifications can affect the surface chart visualization. Feel free to find the interactive version on the playground. But for now, keep reading because this is just the beginning.
<!DOCTYPE html>
<html lang="en">
  <head>
    <meta charset="utf-8">
    <title>JavaScript 3D Surface Plot</title>
    <script src="https://cdn.anychart.com/releases/8.11.0/js/anychart-core.min.js"></script>
    <script src="https://cdn.anychart.com/releases/8.11.0/js/anychart-surface.min.js"></script>
    <script src="https://cdn.anychart.com/releases/8.11.0/js/anychart-data-adapter.min.js"></script>
    <style type="text/css">
      html, body, #container {
        width: 100%;
        height: 100%;
        margin: 0;
        padding: 0;
      }
    </style>
  </head>
  <body>
    <div id="container"></div>
    <script>
      anychart.onDocumentReady(function () {
        anychart.data.loadJsonFile('https://gist.githubusercontent.com/awanshrestha/9d0f4c864817d5ee043126f63f1f4d02/raw/91cb71ac4159ce86bbe2eb204c190f1e9ce43ba6/surface-test.json',
        function (data) {
          // pre-process the data
          var result = [];
          for (var x = 0; x < data.x.length; x++) {
            for (var y = 0; y < data.y.length; y++) {
              result.push([x, data.y[y], data.z[x][y]]);
            }
          }
          // create a surface chart
          var chart = anychart.surface(result);
          // set the x-axis label format
          chart
            .xAxis()
            .labels()
            .format(function () {
              return data.x[Math.round(this.value)];
            });
          // set the x-scale maximum
          chart.xScale().maximum(data.x.length - 1);
          // set the chart padding
          chart.padding(50, 50, 50, 75);
          // set the default chart rotation by the y-axis
          chart.rotationY(40);
          // set the default chart rotation by the z-axis
          chart.rotationZ(130);
          // set the chart title
          chart.title('Population Growth of Top 50 Most Populous Countries Over Past 50 Years');
          // set the container id for the chart
          chart.container('container');
          // initiate the visualization
          chart.draw();
        });
      });
    </script>
  </body>
</html>
B. How to Customize 3D Surface Plot
Once we’ve got a basic 3D surface plot up and running, it’s time to have some fun with it! Here are some simple, yet effective customizations to take your chart to the next level.
1. Jazz up the labels and axes
Let’s start by giving our X, Y, and Z axis stroke colors a makeover. I personally like black, but you can choose any color you fancy.
chart.xAxis().stroke('#000');
chart.yAxis().stroke('#000');
chart.zAxis().stroke('#000');
Next, we can tweak the minimum and maximum scale values of the Y-axis to suit our data.
chart.yScale().minimum(1971);
chart.yScale().maximum(2021);
We can also fine-tune the intervals between the ticks on our scales to make them more readable.
chart.xScale().ticks().interval(1);
chart.yScale().ticks().interval(5);
Lastly, we can use the rotation() parameter of the labels() method to adjust the rotation of the X-axis labels, and hide the last label on the Y-axis for a cleaner look.
// set the x-axis label rotation
chart.xAxis().labels().rotation(90);

// hide the last label on the y-axis
chart.yAxis().drawLastLabel(false);
2. Spice up the color palette
Who says data visualization can’t be beautiful? Let’s add some color to our 3D surface chart! We’ll start by creating a linear color scale using anychart.scales.linearColor(), and then set the color palette to our liking.
// create a color scale
let customColorScale = anychart.scales.linearColor();
customColorScale.colors([
  '#76BA99',
  '#FDFF00',
  '#FD841F',
  '#E14D2A'
]);

// set the color scale
chart.colorScale(customColorScale);
After our color palette customizations, voilà! Our 3D surface plot looks stunning, doesn’t it?
3. Add a color range
To make our chart even more user-friendly, we can add a color range indicator to show what each color represents. We can do this using the colorRange() method.
chart.colorRange().enabled(true).orientation('right');Feel free to experiment with different color range settings.
4. Give it some rotation controls
Now it’s time to get interactive! We can add rotation controls to our 3D surface plot by inserting the following code in the head section. This creates a simple interface with two range input sliders, each with a label indicating which axis it controls.
When the user moves the Y slider, the onInput event handler rotateY() is called, updating the rotation of the chart along the Y-axis. Similarly, when the user moves the Z slider, the onInput event handler rotateZ() is called, updating the rotation of the chart along the Z-axis.
We can set the minimum, maximum, and step values for our input sliders in the code snippet below.
<!-- rotation controls -->
<fieldset>
  <legend>Rotation control</legend>
  Y: <input type="range" id="rotationY" min="-90" max="90" step="1" value="40" onInput="rotateY()">
  Z: <input type="range" id="rotationZ" min="-180" max="180" step="1" value="60" onInput="rotateZ()">
</fieldset>
And to make things pretty, we can add some CSS styling for a fieldset element.
fieldset {
  font-family: Verdana;
  font-size: 13px;
  border: none;
  margin-top: 20px;
}
Lastly, we declare a variable theChart above the anychart.onDocumentReady() function.
let theChart;And we assign it the value of our chart variable from Step 4.
var chart = anychart.surface(result);
theChart = chart;
To make our rotation controls functional, we need to define two functions named rotateY and rotateZ, which update the rotation of the 3D surface plot on the Y and Z-axes respectively and are called when the user interacts with the corresponding input sliders of the HTML page.
These functions use the document.getElementById() method to retrieve the current value of the corresponding range input slider, and convert it to a number using the unary plus operator. The value represents the degree of rotation to be applied to the chart along the corresponding axis. Each function then calls a method on the theChart object to update the rotation accordingly.
// rotation control y
let rotateY = function() {
  let value = +document.getElementById('rotationY').value;
  theChart.rotationY(value);
};

// rotation control z
let rotateZ = function() {
  let value = +document.getElementById('rotationZ').value;
  theChart.rotationZ(value);
};
And there you have it! Our engaging and interactive 3D surface plot is complete – see it just below! You can check out the full source code on the playground and experiment with colors, interactivity, and other elements to your heart’s content. Get creative and have fun with it! The full code is also below for your convenience.
<!DOCTYPE html>
<html lang="en">
  <head>
    <meta charset="utf-8">
    <title>JavaScript Surface Chart</title>
    <script src="https://cdn.anychart.com/releases/8.11.0/js/anychart-core.min.js"></script>
    <script src="https://cdn.anychart.com/releases/8.11.0/js/anychart-surface.min.js"></script>
    <script src="https://cdn.anychart.com/releases/8.11.0/js/anychart-data-adapter.min.js"></script>
    <style type="text/css">
      html, body, #container {
        width: 100%;
        height: 100%;
        margin: 0;
        padding: 0;
      }
      fieldset {
        font-family: Verdana;
        font-size: 13px;
        border: none;
        margin-top: 20px;
      }
    </style>
  </head>
  <body>
    <!-- rotate controls -->
    <fieldset>
      <legend>Rotation controls:</legend>
      Y: <input type="range" id="rotationY" min="-90" max="90" step="1" value="40" onInput="rotateY()">
      Z: <input type="range" id="rotationZ" min="-180" max="180" step="1" value="60" onInput="rotateZ()">
    </fieldset>
    <div id="container"></div>
    <script>
      anychart.onDocumentReady(function () {
        anychart.data.loadJsonFile('https://gist.githubusercontent.com/awanshrestha/9d0f4c864817d5ee043126f63f1f4d02/raw/91cb71ac4159ce86bbe2eb204c190f1e9ce43ba6/surface-test.json',
        function (data) {
            // pre-processing of the data
            var result = [];
            for (var x = 0; x < data.x.length; x++) {
              for (var y = 0; y < data.y.length; y++) {
                result.push([x, data.y[y], data.z[x][y]]);
              }
            }
            // create a surface chart
            var chart = anychart.surface(result);
            // set the x-axis label format
            chart
              .xAxis()
              .labels()
              .format(function () {
                return data.x[Math.round(this.value)];
              });
            // set the x-axis scale maximum
            chart.xScale().maximum(data.x.length - 1);
            // set the chart paddings
            chart.padding(50, 50, 50, 75);
            // set the default chart rotation by the y-axis
            chart.rotationY(40);
            // set the default chart rotation by the z-axis
            chart.rotationZ(130);
            // set the chart title
            chart.title('Population Growth of Top 50 Most Populous Countries in Last 50 Years');
            // set the container id for the chart
            chart.container('container');
            // initiate the visualization
            chart.draw();
          }
        );
      });
    </script>
  </body>
</html>
Conclusion
Congratulations! You have now learned how to create a stunning 3D surface plot using JavaScript. This data visualization technique allows you to showcase complex data in an easy-to-understand way.
By following the steps outlined in this tutorial, you can create surface charts that not only look beautiful but also provide valuable insights into your data. Refer to the surface chart documentation to master more modification options.
If you have any questions or feedback, please feel free to leave a comment. I’m always happy to help and hear your thoughts.
I hope you enjoyed this tutorial and feel inspired to create your own customizations and experiment with your data. Let’s continue to explore the vast world of data visualization together!
AnyChart thanks Awan Shrestha for this awesome 3D Surface Plot tutorial!
See more JavaScript charting tutorials on our blog!
Would you like us to publish your cool guest post? Let us know!
- Categories: AnyChart Charting Component, Big Data, HTML5, JavaScript, JavaScript Chart Tutorials, Tips and Tricks
- No Comments »