 Here are some of the cool, engaging data visualizations we’ve come across these days. They are great examples of how awesome and informative charts can be when they truly let data talk.
The visualizations we are featuring this time on DataViz Weekly are as follows:
- Differences between men and women’s everyday life with kids — FlowingData
- 50 maps showing various aspects of the American life — Business Insider
- New population estimates for the United Kingdom — ONS
- Light pollution around the globe — Jurij Stare
Engaging Data Visualizations in Data Viz Weekly: June 28, 2019 — July 5, 2019
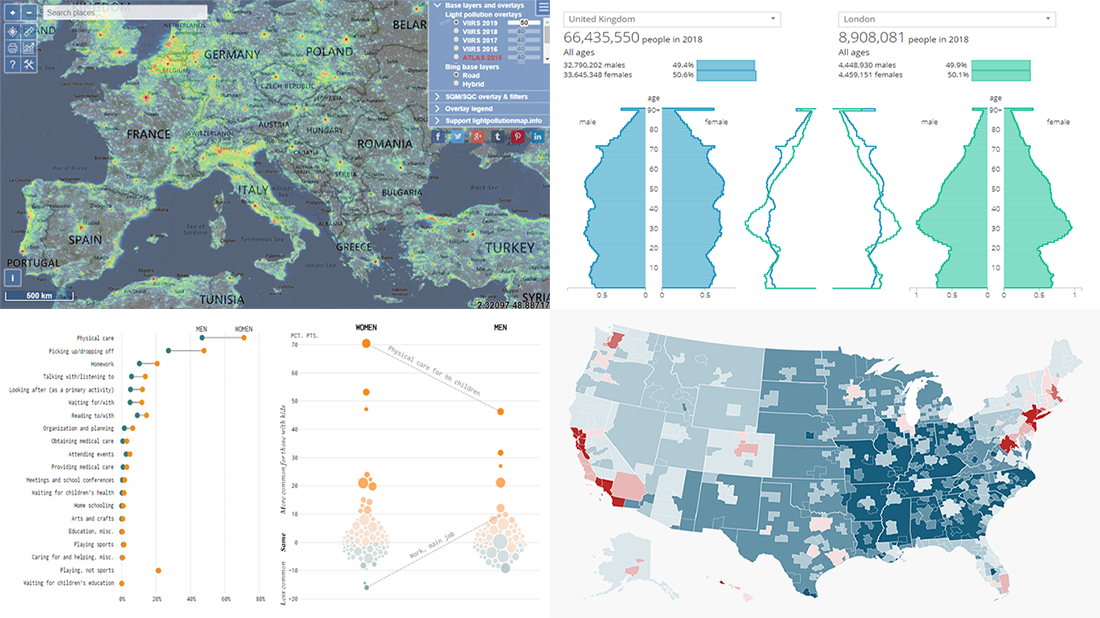
Differences Between Men and Women’s Everyday Life with Kids
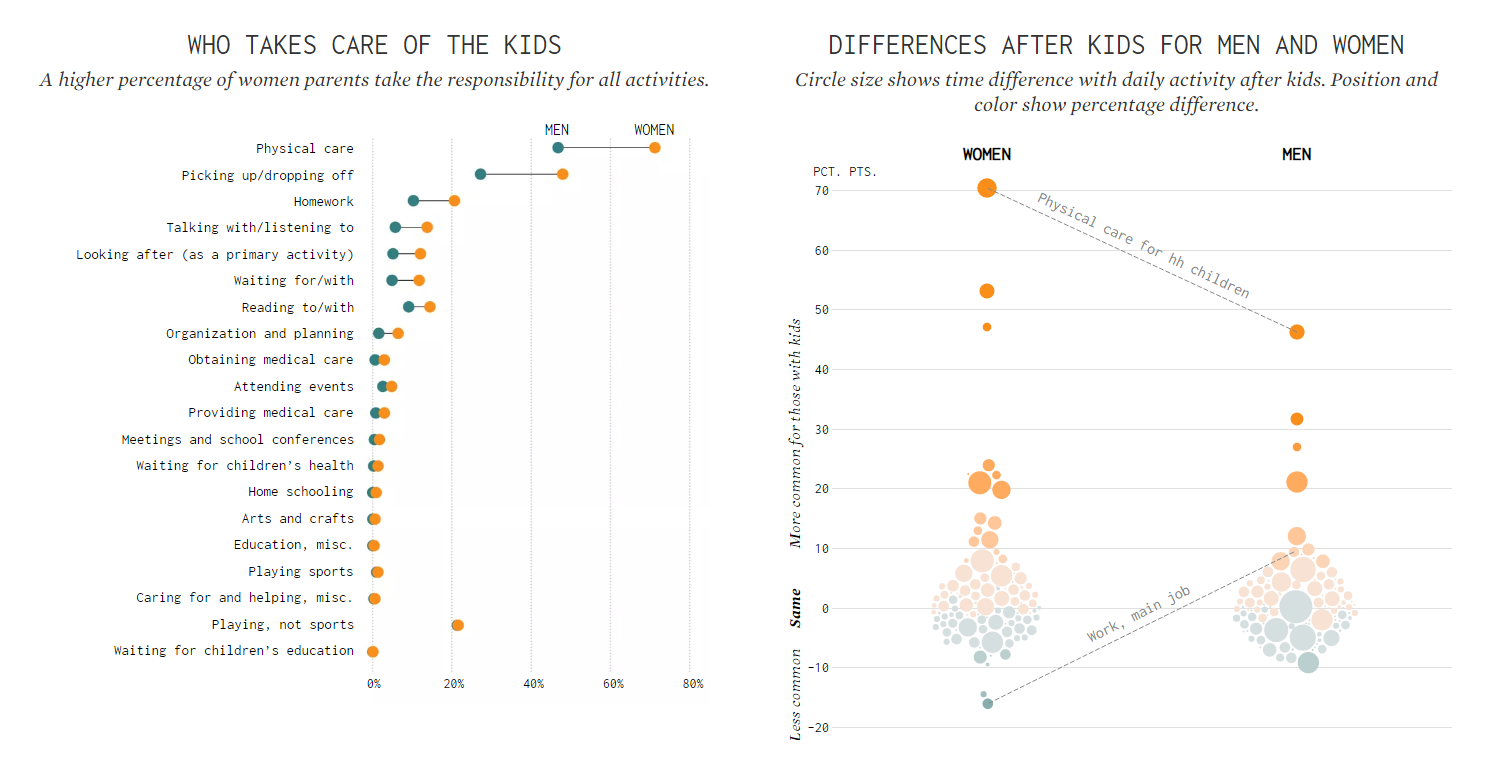
Two weeks ago, we told you about Nathan Yau’s visualization of how having kids changes the everyday life. Now, we invite you to check out his new project in which he continues to look into the American Time Use Survey data regarding people with kids, this time focusing on differences between men and women’s everyday as parents. Check out the two charts in a new Data Underload piece on FlowingData to find out who takes most of the responsibility for child care activities and how much daily activities change for women and men after they start having kids.
50 Maps of America
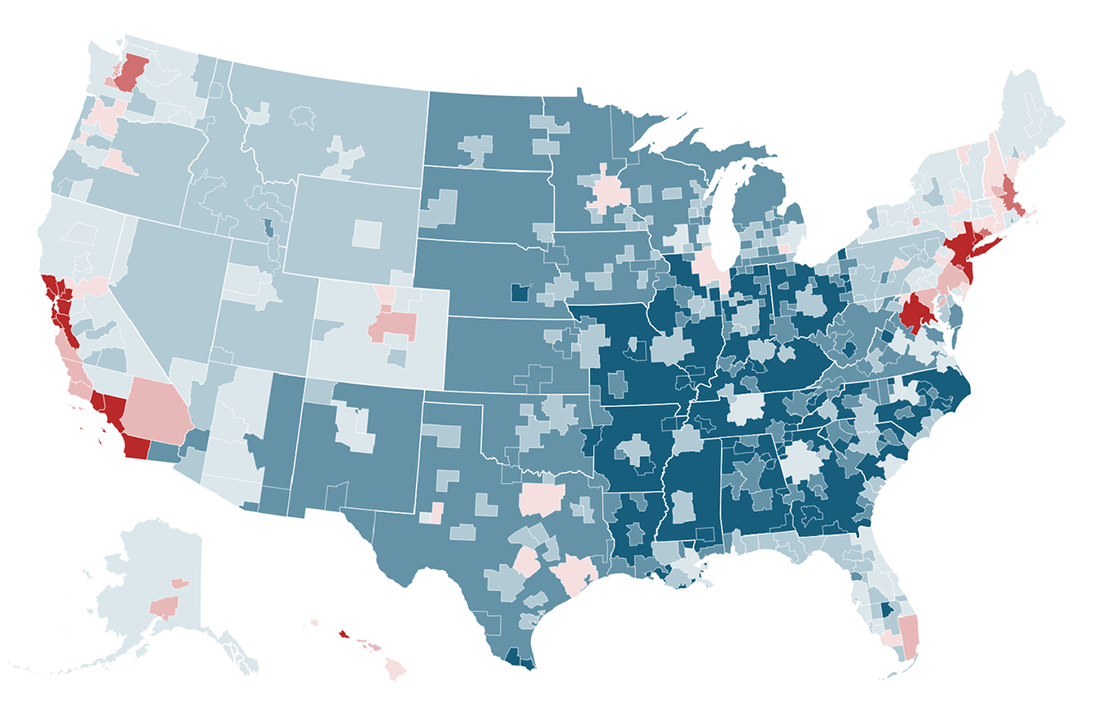
A few days before the 4th of July, Independence Day in the United States, Business Insider’s Andy Kiersz, Shayanne Gal and Olivia Reaney put together a collection of fifty maps that show various aspects of what America is. In particular, the visualizations featured in the article can nicely explain who Americans are, how they live, how the make and spend money, and how they believe. Take a look. Happy Fourth of July, America!
United Kingdom Population Estimates for Mid-2018
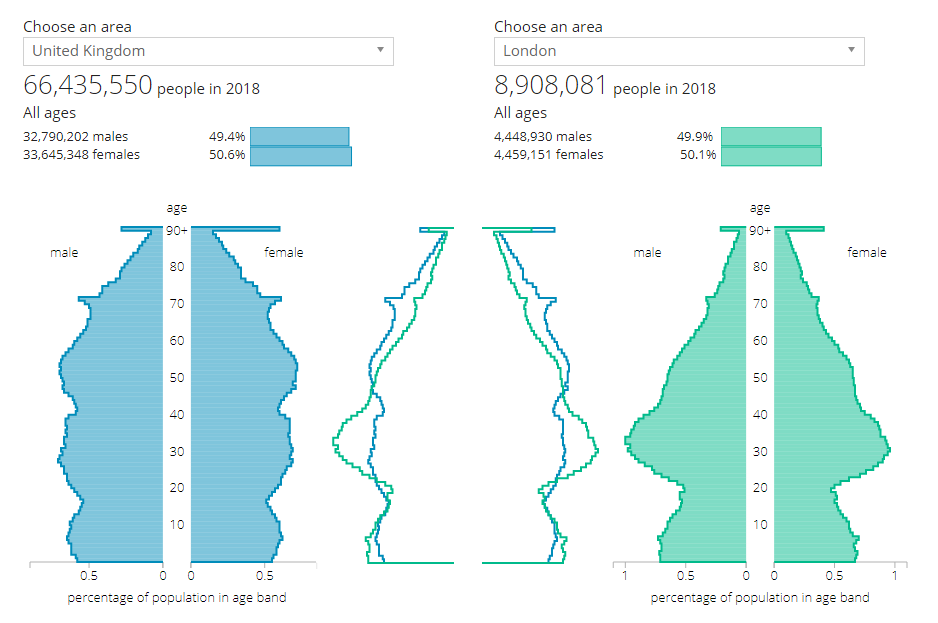
The Office for National Statistics of the United Kingdom released new, mid-2018 population estimates statistics for the United Kingdom and its constituent countries — England and Wales, Scotland, and Northern Ireland. According to the new data, the population of the United Kingdom in the middle of 2018 is estimated at 66,436,000. Learn about other figures and see some cool charts in the report on the ONS website.
Light Pollution Worldwide
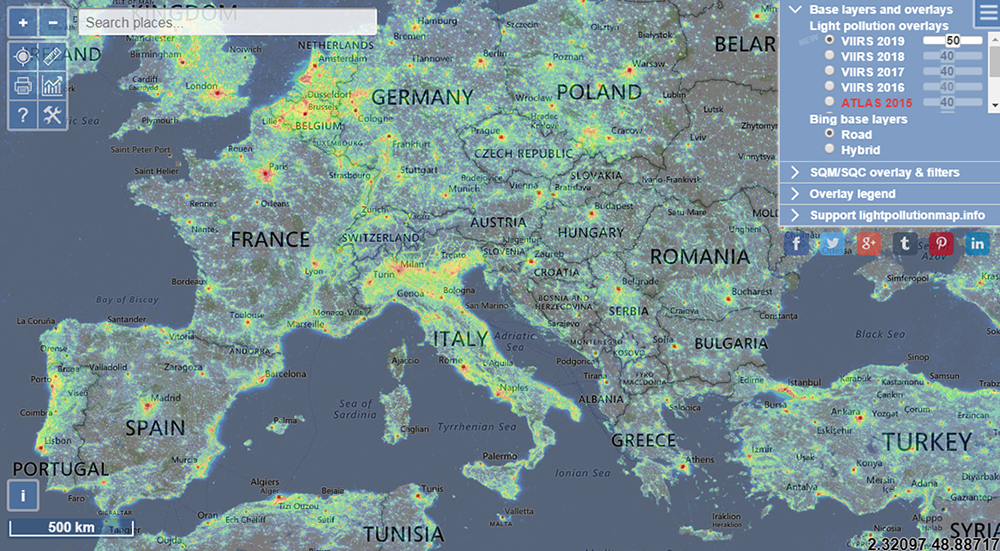
Slovenian astronomer Jurij Stare updated his awesome light pollution map which is based on visualization of VIIRS and DMSP data provided by the Earth Observation Group and NOAA National Geophysical Data Center. (VIIRS stands for the Visible Infrared Imaging Radiometer Suite; DMSP stands for the Defense Meteorological Satellite Program.) The map now includes the VIIRS data overlay for 2019. Check out this cool data visualization project to analyze the most current levels of light pollution around the globe.
***
Check out these great engaging data visualizations and have a great weekend time everyone!
- Categories: Data Visualization Weekly
- No Comments »