Scottish engineer and political economist William Playfair is credited with inventing not only the bar chart but also the area charts.
Generally speaking, Playfair’s publication The Commercial and Political Atlas, first appeared in 1786, contained many interesting time-series graphs. The following two of them are more particularly mentioned today as the first area charts in history.
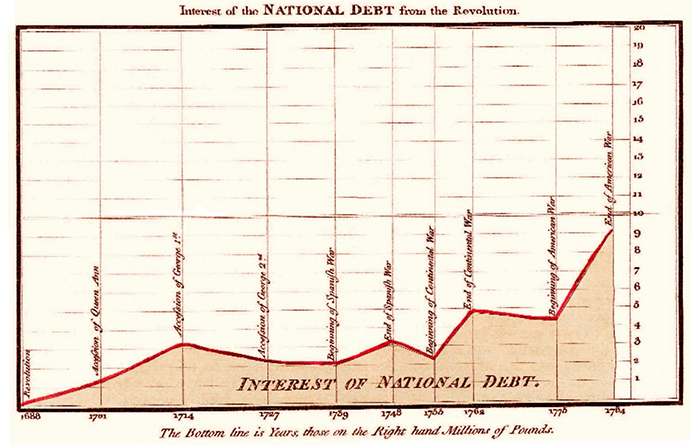
1. Interest of the National Debt from the Revolution. Single-series.
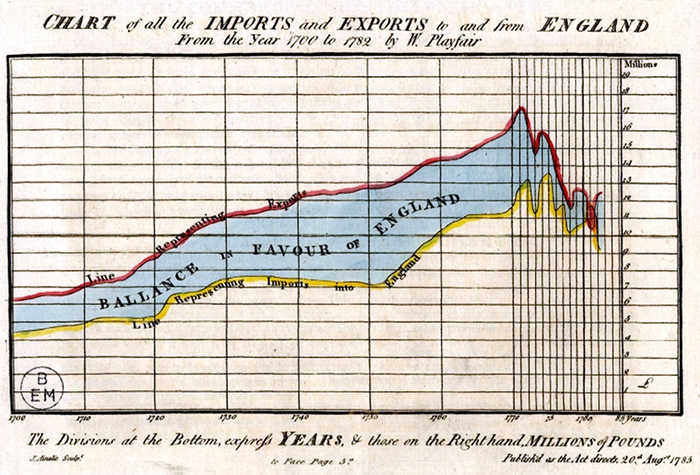
2. Chart of all the Imports and Exports to and from England from the Year 1700 to 1782, originally dated August 20th, 1785. This chart can also be treated as at least one of the first multi-series area charts. The area between two curves shows the difference between them and is a great visual representation of the balance of trade.
When speaking about the first area charts in history, many sources also refer to the third edition of The Commercial and Political Atlas, as well as Playfair’s other prominent publication, Statistical Breviary (both issued in 1801). Let’s take a look at just a couple more of fascinating masterpieces of that time, which make so much sense even today.
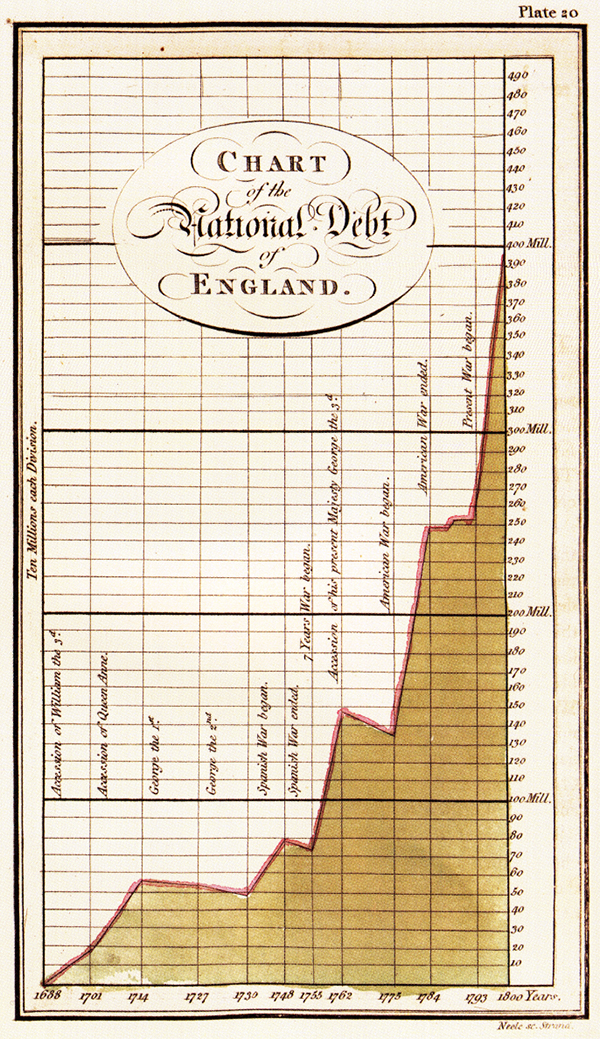
The Chart of the National Debt of England clearly testifies the strong relation between wars and the increase in national debt.
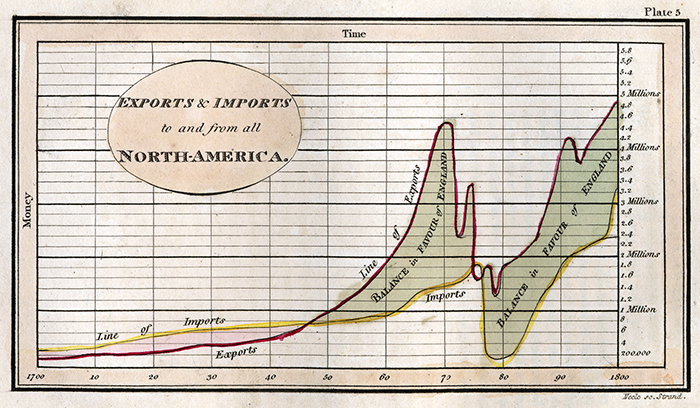
And now the Exports & Imports to and from all North America chart is below. We can notice the American Revolution brought trade between England and its former overseas colonies to a standstill during the war. However, it quickly recovered and began to expand very quickly. As Playfair wrote in his accompanying notes, his country’s idea of keeping America dependent was “rapacious, impolitic, and unjust”, for England’s trade advantage was now greater than ever…
History is amazing! However, now you are more than welcome to visit our contemporary chart gallery. There you will find great-looking, interactive area, spline-area, step-area and all other charts that you can easily create with AnyChart JavaScript Charting Library.
References:
– Jürgen Symanzik, William (Zelli) Fischetti, Ian Spence (2009). Commemorating William Playfair’s 250th Birthday. Utah State University
– William Playfair (2005). Commercial and Political Atlas and Statistical Breviary. Cambridge University Press
– Edward Tufte (2001). The Visual Display of Quantitative Information. Graphics Press
– H. Gray Funkhouser (1937). Historical Development of the Graphical Representation of Statistical Data. Osiris, 3
- Categories: Interesting Facts
- 3 Comments »