 Treemap is a popular chart type for hierarchical data visualization. I’ll show you how to create a cool interactive treemap chart using JavaScript in four simple steps right now. Join me on this quick tutorial for front-end web developers and data viz enthusiasts to understand the core principles of the process. Basically, I am sure everyone at least a little familiar with coding in HTML5 will love the presented, easy way to make beautiful JavaScript treemap charts that are perfectly suitable to be embedded into any web page or app.
In honor of World Wide Web Day celebrated today, August 1, I will develop a JS treemap visualizing data about the number of worldwide internet users as of January 2019, by region, available on Statista.
How to Create JavaScript Treemap Chart
To start with, here’s a basic thing you should clearly understand and remember. When it comes to data visualization using JavaScript, charting generally takes four main steps:
- First, create an HTML page with a container for a chart.
- Second, connect all the scripts you need.
- Third, load the data you need to visualize.
- Finally, write the JS chart code.
Now, let’s delve into each of these steps for streamlined, first-class JavaScript charting and build an awesome treemap.
Step 1: Create an HTML page
Before you actually begin to draw a treemap chart, create an HTML page on which your visualization will be placed.
Below is a very basic example of how it can look.
<!DOCTYPE html>
<html>
  <head>
    <title>My First JavaScript Treemap Chart</title>
    <style>
      html, body, #container {
        width: 100%;
        height: 100%;
        margin: 0;
        padding: 0;
      }
    </style>
  </head>
  <body>
    <div id="container"></div>
  </body>
</html>
The most important part here is, I’ve created a chart container in the <head> section of the HTML code. It is a block-level HTML element in which the chart will be drawn. You are welcome to configure the chart container parameters in the <style> script added to the <head> section to your liking. I want my treemap to occupy the entire page, so I’ve specified 100% in the width and height fields to make it happen just like that.
You see I’ve also added a relevant web page title right away: “My First JavaScript Treemap Chart.”
Step 2: Connect scripts
Next, connect all the scripts that are necessary to create a treemap chart you want to get.
I am using the JavaScript charts library by AnyChart, which is a powerful, flexible solution with comprehensive API reference and documentation, free for non-profit use. It features a modular system that allows me to connect only those chart types and features I actually need, which helps to reduce the size of my JavaScript and speed up everything.
To represent data on a treemap chart, the core and treemap modules are required. So I reference them in the <head> section, in separate <script> tags:
<script>https://cdn.anychart.com/releases/v8/js/anychart-core.min.js</script>
<script>https://cdn.anychart.com/releases/v8/js/anychart-treemap.min.js</script>
If you prefer to launch these scripts locally instead of making use of the AnyChart CDN, you can download them into a folder on your website and use your own URLs.
AnyChart has no dependencies, so there is no need to connect anything else.
The treemap chart’s JavaScript code will be written in the <script> tag inserted in the <body> section.
Check out how the code framework looks as of now:
<!DOCTYPE html>
<html>
  <head>
    <title>My First JavaScript Treemap Chart</title>
      <script>https://cdn.anychart.com/releases/v8/js/anychart-core.min.js</script>
      <script>https://cdn.anychart.com/releases/v8/js/anychart-treemap.min.js</script>
      <style>
        html, body, #container {
          width: 100%;
          height: 100%;
          margin: 0;
          padding: 0;
        }
    </style>
  </head>
  <body>
    <script>
	<!-- The treemap chart code will be written here -->
    </script>
  </body>
</html>
Step 3: Load data
Now that we’ve prepared a place for the treemap graph visualization (step 1) and referenced the JS charting library scripts (step 2), all is set to get to the essence — load data (step 3) and actually plot it on a treemap (step 4).
The AnyChart JS library allows web developers to choose from a range of ways to work with data. To create treemap charts, it is necessary to apply the tree data model, organizing data as a tree, as a table, or as a CSV string.
In this case, I’ve decided to organize data as a tree, with every parent item provided with a children data field containing an array of child items:
var data = [
  {name: "World", children: [
    {name: "Asia", children: [
      {name: "East", value: 1000},
      {name: "Southern", value: 803},
      {name: "Southeast", value: 415},
      {name: "Western", value: 182},
      {name: "Central", value: 36}
    ]},
    {name: "America", children: [
      {name: "North", value: 346},
      {name: "South", value: 316},
      {name: "Central", value: 114},
      {name: "Caribbean", value: 23}
    ]},
    {name: "Europe", children: [
      {name: "Eastern", value: 233},
      {name: "Western", value: 183},
      {name: "Southern", value: 135},
      {name: "Northern", value: 100}
    ]},
    {name: "Africa", children: [
      {name: "Western", value: 158},
      {name: "Eastern", value: 140},
      {name: "Northern", value: 121},
      {name: "Southern", value: 34},
      {name: "Middle", value: 20}
    ]},
    {name: "Oceania", children: [
      {name: "Oceania", value: 29}
    ]}
  ]}
];
Step 4: Code the JS treemap chart
Now, let’s code the visualization.
The entire JS chart code must be included in the anychart.onDocumentReady() function within the <script> tag. So first, add the function:
<script>
  anychart.onDocumentReady(function() {
    // the entire code of the treemap chart will be here
  });
</script>
Second, add the data from step 3 and command to create a data tree:
anychart.onDocumentReady(function() {

  // create data
  var data = [
    {name: "World", children: [
      {name: "Asia", children: [
        {name: "East", value: 1000},
        {name: "Southern", value: 803},
        {name: "Southeast", value: 415},
        {name: "Western", value: 182},
        {name: "Central", value: 36}
      ]},
      {name: "America", children: [
        {name: "North", value: 346},
        {name: "South", value: 316},
        {name: "Central", value: 114},
        {name: "Caribbean", value: 23}
      ]},
      {name: "Europe", children: [
        {name: "Eastern", value: 233},
        {name: "Western", value: 183},
        {name: "Southern", value: 135},
        {name: "Northern", value: 100}
      ]},
      {name: "Africa", children: [
        {name: "Western", value: 158},
        {name: "Eastern", value: 140},
        {name: "Northern", value: 121},
        {name: "Southern", value: 34},
        {name: "Middle", value: 20}
      ]},
      {name: "Oceania", children: [
        {name: "Oceania", value: 29}
      ]}
    ]}
  ];

  // create a data tree
  treeData = anychart.data.tree(data, "as-tree");

});
Third, add the following line to create a treemap chart based on the data tree:
var chart = anychart.treeMap(treeData);Fourth, name the chart to make it clear what is displayed on the graphics:
chart.title("Internet Audience Worldwide (in million users)");Finally, command to draw the treemap chart in the container:
// set the container id
chart.container("container");

// draw the chart
chart.draw();
There you go: Check out the interactive treemap chart just built with JavaScript!
Result: Treemap chart built with JavaScript
Note that the treemap chart comes with pre-determined visual design and interactivity settings by default. In particular, it features the awesome drill down behavior: When you click on a data point, you drill down to its child items. To return and drill up to a higher level, click on the header.
You are welcome to check out this basic treemap chart example on the AnyChart Playground and play with its code right there.
For your convenience, here’s the full HTML code of this treemap:
<!DOCTYPE html>
<html>
  <head>
    <title>My First JavaScript Treemap Chart</title>
    <script>https://cdn.anychart.com/releases/v8/js/anychart-core.min.js</script>
    <script>https://cdn.anychart.com/releases/v8/js/anychart-treemap.min.js</script>
    <style>
      html, body, #container {
        width: 100%;
        height: 100%;
        margin: 0;
        padding: 0;
      }
    </style>
  </head>
  <body>
    <script>
      anychart.onDocumentReady(function() {

        // create data
        var data = [
          {name: "World", children: [
            {name: "Asia", children: [
              {name: "East", value: 1000},
              {name: "Southern", value: 803},
              {name: "Southeast", value: 415},
              {name: "Western", value: 182},
              {name: "Central", value: 36}
            ]},
            {name: "America", children: [
              {name: "North", value: 346},
              {name: "South", value: 316},
              {name: "Central", value: 114},
              {name: "Caribbean", value: 23}
            ]},
            {name: "Europe", children: [
              {name: "Eastern", value: 233},
              {name: "Western", value: 183},
              {name: "Southern", value: 135},
              {name: "Northern", value: 100}
            ]},
            {name: "Africa", children: [
              {name: "Western", value: 158},
              {name: "Eastern", value: 140},
              {name: "Northern", value: 121},
              {name: "Southern", value: 34},
              {name: "Middle", value: 20}
            ]},
            {name: "Oceania", children: [
              {name: "Oceania", value: 29}
            ]}
          ]}
        ];

        // create a data tree
        var treeData = anychart.data.tree(data, "as-tree");

        // create a treemap chart visualizing the data tree
        var chart = anychart.treeMap(treeData);

        // add a title for the chart
        chart.title("Internet Audience Worldwide (in million users)");

        // specify the container id
        chart.container("container");

        // draw the chart
        chart.draw();

      });
    </script>
  </body>
</html>
How to Customize JS Treemap Chart Design
So, the treemap chart built just above has basic visual features according to the default settings configured for this chart type in the AnyChart library. However, it is possible to customize everything real quick in compliance with your personal preferences or corporate (brand) requirements for design, if needed.
I’ll show you some examples below so you can learn how to create an even better-looking treemap chart in a matter of minutes or seconds.
Add hints
By default, treemaps show data points that belong to the same hierarchy level only. But you have full control over what to display. For example, I want to outline the lower-level child items, keeping them slightly visible so anyone viewing the chart (e.g. a data analyst) can judge them as well on the big picture.
To show such hints, I make use of the hintDepth() method with the value 1, meaning that I want the elements of one more level to be indicated on the treemap:
chart.hintDepth(1);To avoid attracting too much attention to the lower-level elements when the higher-level elements are shown, I reduce the hint opacity:
chart.hintOpacity(0.7);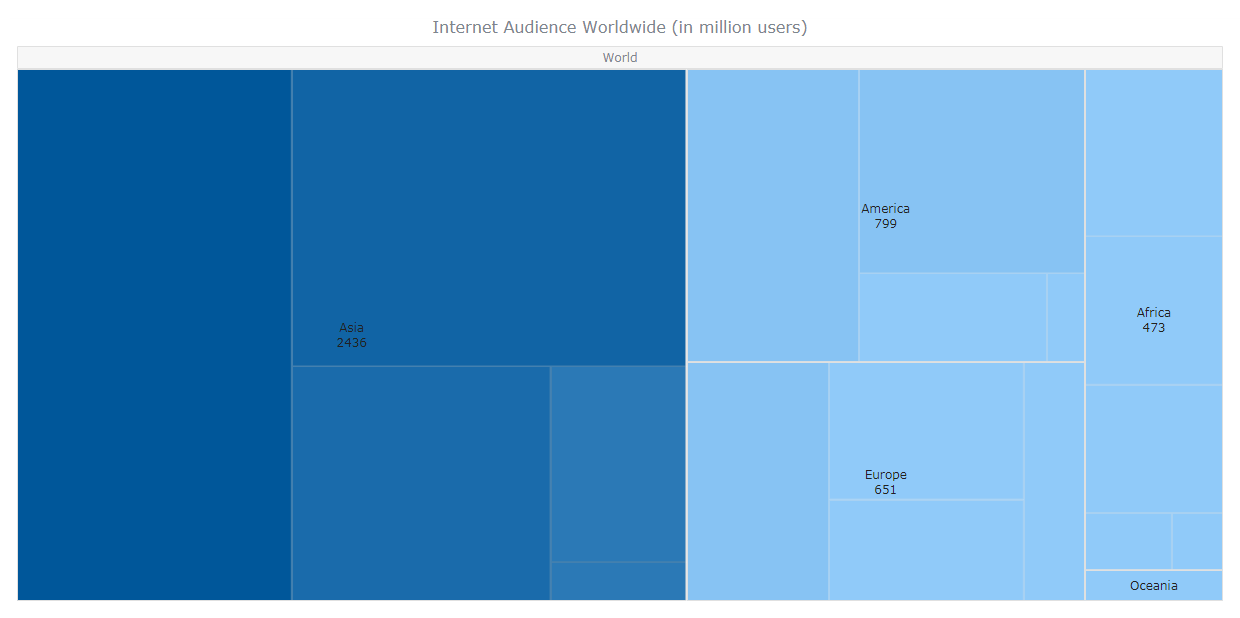
Change colors
Also, you can quickly change the treemap chart design in terms of coloring.
For example, I want to change some of the appearance settings for the hovered, selected, and normal states by setting custom fill and stroke settings. To get such a new picture, I combine the hovered(), selected(), and normal() methods with the fill() — hatchFill() for the hatch fill type — and stroke() methods, specifying the colors and opacity parameters right there:
chart.hovered().fill("silver", 0.2);
chart.selected().fill("silver", 0.6);
chart.selected().hatchFill("backward-diagonal", "silver", 2, 20);
chart.normal().stroke("silver");
chart.hovered().stroke("gray", 2);
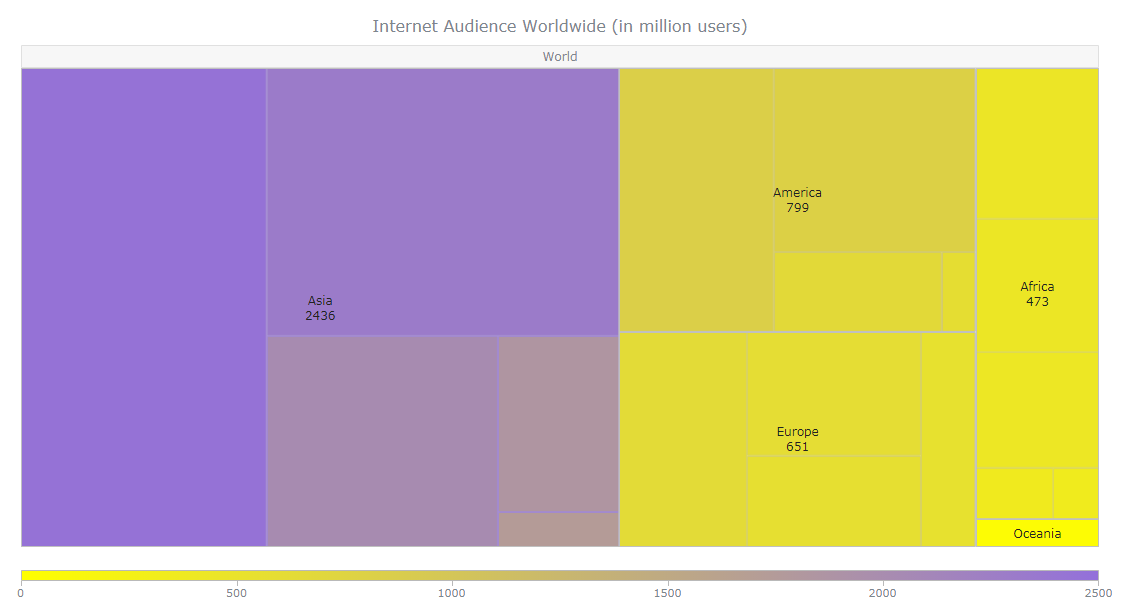
chart.selected().stroke("gray", 2);In addition, I’ve decided to make a custom color scale, apply it to the treemap chart, and display the corresponding color range at the bottom. Follow me along the code to grasp the idea:
// create and configure a custom color scale
var customColorScale = anychart.scales.linearColor();
customColorScale.colors(["Yellow", "MediumPurple"]);

// apply the custom color scale to the treemap chart
chart.colorScale(customColorScale);

// add a color range
chart.colorRange().enabled(true);
chart.colorRange().length("100%");
To see all supported web colors with their hexadecimal and RGB codes, refer to Color Table.
Enable HTML in treemap elements
Last but not least, I’ll show you how to customize the tooltips, labels, and titles with the help of HTML. It’s very easy, too.
Begin with enabling HTML for the corresponding parts of the chart by adding of the useHtml() method with the true value.
Then, feel free to use HTML. For example:
HTML in the treemap chart title:
// enable HTML in the chart title
chart.title().useHtml(true);
// configure the chart title
chart.title(
  "<span style='font-size:18; font-style:bold'>Internet Audience Worldwide</span><br><i><span style='font-size:14; font-style:italic'>In million users</i>"
);
HTML in treemap tooltips:
// enable HTML in the chart tooltips
chart.tooltip().useHtml(true);
// configure the chart tooltips
chart.tooltip().format(
  "Internet audience: {%value} million users<br><i>(As of January 2019.)</i>"
);
HTML in treemap labels:
// enable HTML in the chart labels
chart.labels().useHtml(true);
// configure the chart labels
chart.labels().format(
  "<span style='font-weight:bold'>{%name}</span><br>{%value}"
);
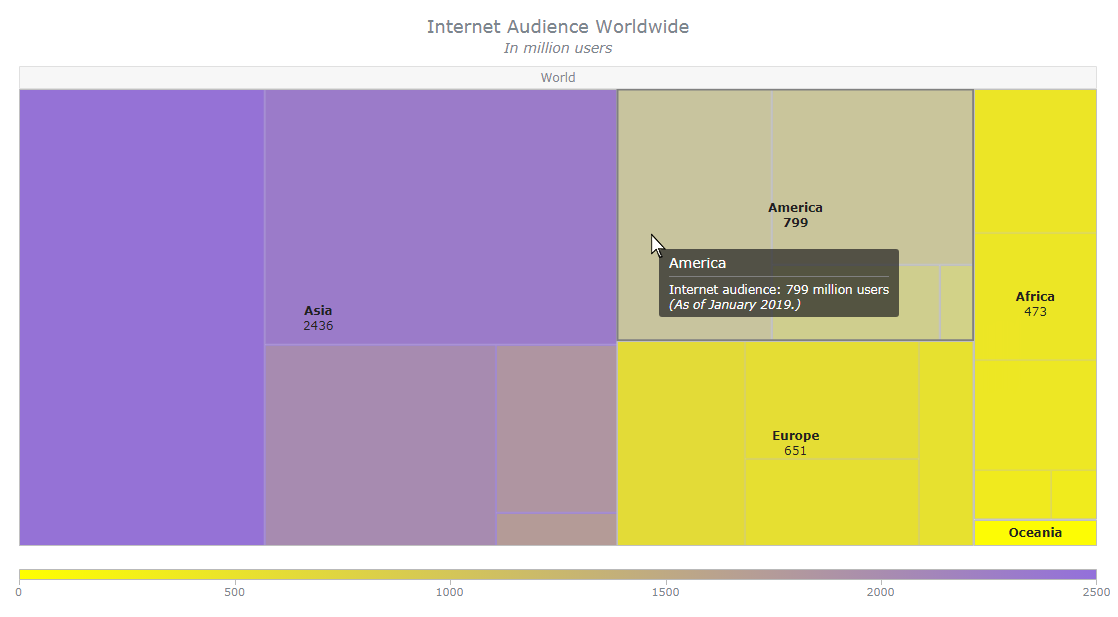
Result: Custom treemap chart built with JavaScript
Below is the resulting, customized JavaScript (HTML5) treemap chart. Needless to say, there are a lot of other settings you can adjust to get the data visualization you want and you can actually modify everything. See the Treemap Chart documentation to delve into more details on exactly what is possible and how, with code samples and illustrations.
Take a look at this customized treemap chart on the AnyChart Playground.
Here’s the full HTML code of this treemap:
<!DOCTYPE html>
<html>
  <head>
    <title>My First JavaScript Treemap Chart</title>
      <script>https://cdn.anychart.com/releases/v8/js/anychart-core.min.js</script>
      <script>https://cdn.anychart.com/releases/v8/js/anychart-treemap.min.js</script>
      <style>
        html, body, #container {
          width: 100%;
          height: 100%;
          margin: 0;
          padding: 0;
        }
    </style>
  </head>
  <body>
    <script>
      anychart.onDocumentReady(function() {

        // create data
        var data = [
          {name: "World", children: [
            {name: "Asia", children: [
              {name: "East", value: 1000},
              {name: "Southern", value: 803},
              {name: "Southeast", value: 415},
              {name: "Western", value: 182},
              {name: "Central", value: 36}
            ]},
            {name: "America", children: [
              {name: "North", value: 346},
              {name: "South", value: 316},
              {name: "Central", value: 114},
              {name: "Caribbean", value: 23}
            ]},
            {name: "Europe", children: [
              {name: "Eastern", value: 233},
              {name: "Western", value: 183},
              {name: "Southern", value: 135},
              {name: "Northern", value: 100}
            ]},
            {name: "Africa", children: [
              {name: "Western", value: 158},
              {name: "Eastern", value: 140},
              {name: "Northern", value: 121},
              {name: "Southern", value: 34},
              {name: "Middle", value: 20}
            ]},
            {name: "Oceania", children: [
              {name: "Oceania", value: 29}
            ]}
          ]}
        ];

        // create a data tree
        var treeData = anychart.data.tree(data, "as-tree");

        // create a treemap chart visualizing the data tree
        var chart = anychart.treeMap(treeData);

        // set the depth of hints
        chart.hintDepth(1);
        // set the opacity of hints
        chart.hintOpacity(0.7);

        // configure the visual settings of the chart
        chart.hovered().fill("silver", 0.2);
        chart.selected().fill("silver", 0.6);
        chart.selected().hatchFill("backward-diagonal", "silver", 2, 20);
        chart.normal().stroke("silver");
        chart.hovered().stroke("gray", 2);
        chart.selected().stroke("gray", 2);

        // create and configure a custom color scale
        var customColorScale = anychart.scales.linearColor();
        customColorScale.colors(["Yellow", "MediumPurple"]);
        // apply the custom color scale to the treemap chart
        chart.colorScale(customColorScale);
        // add the color range
        chart.colorRange().enabled(true);
        chart.colorRange().length("100%");

        // enable HTML in the chart title
        chart.title().useHtml(true);
        // configure the chart title
        chart.title(
          "<span style='font-size:18; font-style:bold'>Internet Audience Worldwide</span><br><i><span style='font-size:14; font-style:italic'>In million users</i>"
        );

        // enable HTML in the chart tooltips
        chart.tooltip().useHtml(true);
        // configure the chart tooltips
        chart.tooltip().format(
          "Internet audience: {%value} million users<br><i>(As of January 2019.)</i>"
        );

        // enable HTML in the chart labels
        chart.labels().useHtml(true);
        // configure the chart labels
        chart.labels().format(
          "<span style='font-weight:bold'>{%name}</span><br>{%value}"
        );

        // set the container id
        chart.container("container");

        // draw the chart
        chart.draw();

      });
    </script>
  </body>
</html>
Wrapping Up
Developing awesome interactive treemap charts using JavaScript is far from rocket science. Even newbies in web development and data visualization with (almost) no coding experience can create these, and basically, any other JS charts, plots, diagrams, and graphs.
Now that you’ve read this JS chart tutorial, enjoy the new knowledge and make good use of it in practice when building simple or more complicated and advanced treemaps in JavaScript/HTML5 — for the best possible, most efficient visualization of hierarchical data in your projects, whether it’s a website, a mobile application, or any software.
Don’t miss out on looking at more treemap chart examples in a dedicated gallery of JavaScript (HTML5) data visualizations.
- Categories: AnyChart Charting Component, HTML5, JavaScript, JavaScript Chart Tutorials, Tips and Tricks
- 2 Comments »