 Network graphs are a practical and effective tool in data visualization, particularly useful for illustrating the relationships and connections within complex systems. These charts are useful for understanding structures in various contexts, from social networks to corporate hierarchies. In this tutorial, we’ll delve into a quick path to creating a compelling, interactive network graph using JavaScript.
We’ll use the Volkswagen Group as our example, mapping out its subsidiaries and product lines to showcase how network graphs can make complex organizational structures understandable and accessible. By the end of this step-by-step guide, you’ll have a clear understanding of how to quickly construct and customize a JS-based network graph. Buckle up, as it’s time to hit the road!
Understanding Network Graphs
Network graphs consist of nodes and edges — nodes represent entities such as individuals or organizations, while edges depict the relationships between them. These visuals are invaluable for dissecting and displaying the architecture of complex networks, revealing both overt and subtle connections.
In practical terms, network graphs can help illustrate the hierarchy within a corporation, the interaction between different departments, or the flow of communication or resources. Visually, these graphs use various elements like node size, color, and edge thickness to convey information about the importance, type, and strength of relationships.
Below is a preview of what we will create by the end of this tutorial — a fully interactive network graph that not only serves as a visual map of the Volkswagen Group but also utilizes the dynamic features of JavaScript for a deeper exploration of data.
Step-by-Step Guide to Building a Network Graph
Creating a network graph involves several key steps, each contributing to the final outcome. Here’s a brief overview of what we’ll cover in this tutorial:
- Creating an HTML page: This is where we set up the structure for our visualization, providing a canvas on which our network graph will be displayed.
- Including the necessary JavaScript files: Essential for graph functionality, we’ll incorporate scripts needed to build and manage our network graph.
- Preparing the data: Here, we’ll organize the data into a format that can be smoothly visualized in a network graph, distinguishing between different types of nodes and their connections.
- Writing the JavaScript code for visualization: The final step involves scripting the logic that brings our graph to life, enabling interactivity to better understand the underlying data.
Each of these steps will be detailed in the following sections, ensuring you have a clear roadmap to follow as you create your own network graph using JavaScript. Let’s dive in and start visualizing!
Step 1: Setting Up Your HTML
Start by creating the basic structure for your web page if you are building from scratch. This includes setting up an HTML document that will host your network graph. Here is how you can write your HTML:
<!DOCTYPE html>
<html>
<head>
  <title>Network Graph in JavaScript</title>
  <style type="text/css">
    html, body, #container {
      width: 100%; height: 100%; margin: 0; padding: 0;
    }
    </style>
</head>
<body>
  <div id="container"></div>
</body>
</html>
This simple HTML structure is foundational. The <div> tag identified by id="container" is where our network graph will be rendered. The accompanying CSS ensures the graph uses the entire screen, optimizing visual space and ensuring that the graph is both prominent and clear.
Step 2: Summoning JavaScript Files
To integrate our network graph into the web environment without much hassle, let’s incorporate a JavaScript charting library directly within the HTML framework. There are multiple libraries out there, although not all of them support network graphs. You can check out this comprehensive comparison of JavaScript charting libraries, which details some features of various libraries, including support for network graphs. Of those listed, libraries such as amCharts, AnyChart, D3.js, and HighCharts are popular options that support network graphs.
For this tutorial, we’ll utilize AnyChart as an example. It’s one of the libraries I’ve used extensively over the years, and I thought it would work well to illustrate the common logic of the process and be easy enough to get started for those of you who are new to JS charting.
Here’s how the necessary JS scripts are woven into the HTML, positioned within the <head> section. Additionally, we prepare the <body> section to include our forthcoming JavaScript code using those scripts, which will dynamically render the network graph:
<html>
  <head>
    <title>Network Graph in JavaScript</title>
    <style type="text/css">
      html, body, #container {
        width: 100%; height: 100%; margin: 0; padding: 0;
      }
    </style>
    <script src="https://cdn.anychart.com/releases/8.12.1/js/anychart-core.min.js"></script>
    <script src="https://cdn.anychart.com/releases/8.12.1/js/anychart-graph.min.js"></script>
  </head>
  <body>
    <div id="container"></div>
    <script>
      // JS code for the network graph will be here
    </script>
  </body>
</html>
Step 3: Sculpting Data
With our HTML ready and JS files at hand, it’s time to define our nodes and edges — the fundamental components of our network graph. This involves structuring the Volkswagen Group’s data, from the parent company to each product line.
var data = {
  "nodes": [
    {"id": "Volkswagen Group", "group": "CoreCompany"},
    {"id": "Audi", "group": "ChildCompany"},
    {"id": "Audi Cars", "group": "Product"},
    // More nodes here...
  ],
  "edges": [
    {"from": "Volkswagen Group", "to": "Audi"},
    {"from": "Audi", "to": "Audi Cars"},
    // More edges here...
  ]
};
Step 4: Choreographing JavaScript to Visualize Network
This crucial step transforms the structured data into a vibrant, interactive network graph within the provided HTML canvas. To ensure clarity and ease of understanding, I’ve divided this process into three intuitive sub-steps, each demonstrated with its own code snippet.
Initializing
First, we ensure that our JavaScript visualization code executes only once the HTML document is fully loaded. This is critical as it prevents any DOM manipulation attempts before the HTML is fully prepared.
anychart.onDocumentReady(function () {
 // Initialization of the network graph will happen here
});
Creating Graph Instance
Inside the function, we initialize our network graph. Here, we create a graph object, a chart, using our predefined data. This instance will serve as the basis for our visualization.
var chart = anychart.graph(data);Setting Container for Graph
The next step is to specify where on the webpage our network graph should be visually rendered. This is linked to the HTML container we defined earlier.
chart.container("container");Rendering Graph
The final step is to instruct the graph to draw itself within the designated container. This action brings our data to life, displaying the complex relationships within the Volkswagen Group.
chart.draw();These sub-steps collectively ensure that our network graph is not only initialized with the correct data and configurations but also properly placed and rendered on the web page, providing a dynamic and informative visual exploration of corporate relationships.
Network Graph Visualization Unfolded
Now that our network graph is complete, you can see the resulting picture below, which showcases the complex structure of the Volkswagen Group. This interactive chart is not only informative but also a testament to the power of JavaScript when it comes to cross-platform interactive data visualization.
For a hands-on experience, I invite you to explore this chart interactively on the AnyChart Playground, where you can modify the code, experiment with different configurations, and better understand the intricacies of network graphs. The complete HTML/CSS/JavaScript code for this project is available below — use it as a reference or a starting point for your own visualization projects.
<html>
  <head>
    <title>Network Graph in JavaScript</title>
    <style type="text/css">
      html, body, #container {
        width: 100%; height: 100%; margin: 0; padding: 0;
      }
    </style>
    <script src="https://cdn.anychart.com/releases/8.12.1/js/anychart-core.min.js"></script>
    <script src="https://cdn.anychart.com/releases/8.12.1/js/anychart-graph.min.js"></script>
  </head>
  <body>
    <div id="container"></div>
    <script>
      anychart.onDocumentReady(function () {
        // Create data
        const data = {
          "nodes": [
            // parent company
            {"id": "Volkswagen Group", "group": "CoreCompany"},
            // child companies
            {"id": "Audi", "group": "ChildCompany"},
            {"id": "CUPRA", "group": "ChildCompany"},
            {"id": "Ducati", "group": "ChildCompany"},
            {"id": "Lamborghini", "group": "ChildCompany"},
            {"id": "MAN", "group": "ChildCompany"},
            {"id": "Porsche", "group": "ChildCompany"},
            {"id": "Scania", "group": "ChildCompany"},
            {"id": "SEAT", "group": "ChildCompany"},
            {"id": "Škoda", "group": "ChildCompany"},
            {"id": "Volkswagen", "group": "ChildCompany"},
            // products
            {"id": "Audi Cars", "group": "Product"},
            {"id": "Audi SUVs", "group": "Product"},
            {"id": "Audi Electric Vehicles", "group": "Product"},
            {"id": "CUPRA Performance Cars", "group": "Product"},
            {"id": "CUPRA SUVs", "group": "Product"},
            {"id": "Ducati Motorcycles", "group": "Product"},
            {"id": "Lamborghini Sports Cars", "group": "Product"},
            {"id": "Lamborghini SUVs", "group": "Product"},
            {"id": "MAN Trucks", "group": "Product"},
            {"id": "MAN Buses", "group": "Product"},
            {"id": "Porsche Sports Cars", "group": "Product"},
            {"id": "Porsche SUVs", "group": "Product"},
            {"id": "Porsche Sedans", "group": "Product"},
            {"id": "Scania Trucks", "group": "Product"},
            {"id": "Scania Buses", "group": "Product"},
            {"id": "SEAT Cars", "group": "Product"},
            {"id": "SEAT SUVs", "group": "Product"},
            {"id": "SEAT Electric Vehicles", "group": "Product"},
            {"id": "Škoda Cars", "group": "Product"},
            {"id": "Škoda SUVs", "group": "Product"},
            {"id": "Škoda Electric Vehicles", "group": "Product"},
            {"id": "Volkswagen Cars", "group": "Product"},
            {"id": "Volkswagen SUVs", "group": "Product"},
            {"id": "Volkswagen Vans", "group": "Product"},
            {"id": "Volkswagen Trucks", "group": "Product"}
          ],
          "edges": [
            // parent to child companies
            {"from": "Volkswagen Group", "to": "Audi"},
            {"from": "Volkswagen Group", "to": "CUPRA"},
            {"from": "Volkswagen Group", "to": "Ducati"},
            {"from": "Volkswagen Group", "to": "Lamborghini"},
            {"from": "Volkswagen Group", "to": "MAN"},
            {"from": "Volkswagen Group", "to": "Porsche"},
            {"from": "Volkswagen Group", "to": "Scania"},
            {"from": "Volkswagen Group", "to": "SEAT"},
            {"from": "Volkswagen Group", "to": "Škoda"},
            {"from": "Volkswagen Group", "to": "Volkswagen"},
            // child companies to products
            {"from": "Audi", "to": "Audi Cars"},
            {"from": "Audi", "to": "Audi SUVs"},
            {"from": "Audi", "to": "Audi Electric Vehicles"},
            {"from": "CUPRA", "to": "CUPRA Performance Cars"},
            {"from": "CUPRA", "to": "CUPRA SUVs"},
            {"from": "Ducati", "to": "Ducati Motorcycles"},
            {"from": "Lamborghini", "to": "Lamborghini Sports Cars"},
            {"from": "Lamborghini", "to": "Lamborghini SUVs"},
            {"from": "MAN", "to": "MAN Trucks"},
            {"from": "MAN", "to": "MAN Buses"},
            {"from": "Porsche", "to": "Porsche Sports Cars"},
            {"from": "Porsche", "to": "Porsche SUVs"},
            {"from": "Porsche", "to": "Porsche Sedans"},
            {"from": "Scania", "to": "Scania Trucks"},
            {"from": "Scania", "to": "Scania Buses"},
            {"from": "SEAT", "to": "SEAT Cars"},
            {"from": "SEAT", "to": "SEAT SUVs"},
            {"from": "SEAT", "to": "SEAT Electric Vehicles"},
            {"from": "Škoda", "to": "Škoda Cars"},
            {"from": "Škoda", "to": "Škoda SUVs"},
            {"from": "Škoda", "to": "Škoda Electric Vehicles"},
            {"from": "Volkswagen", "to": "Volkswagen Cars"},
            {"from": "Volkswagen", "to": "Volkswagen SUVs"},
            {"from": "Volkswagen", "to": "Volkswagen Vans"},
            {"from": "Volkswagen", "to": "Volkswagen Trucks"}
          ]};
        // Initialize the network graph with the provided data structure
        const chart = anychart.graph(data);
        // Specify the HTML container ID where the chart will be rendered
        chart.container("container");
        // Initiate the rendering of the chart
        chart.draw();
      });
    </script>
  </body>
</html>
Customizing JavaScript Network Graph
After establishing a basic network graph of the Volkswagen Group, let’s enhance its functionality and aesthetics. This part of our tutorial will guide you through some of the various customization options, showing you how to evolve your basic JavaScript network graph into a more informative and visually appealing visualization.
Each customization step builds upon the previous code, introducing new features and modifications, and providing the viewer with a deeper understanding of the relationships within the Volkswagen corporate structure.
Displaying Node Labels
Understanding what each node represents is crucial in a network graph. By default, node labels might not be displayed, but we can easily enable them to make our graph more informative.
chart.nodes().labels().enabled(true);Enabling labels on nodes ensures that each node is clearly identified, making it easier for users to understand the data at a glance without needing to interact with each node individually.
Configuring Edge Tooltips
To enhance user interaction, tooltips can provide additional information when hovering over connections (edges) between nodes. This step involves configuring a tooltip format that shows the relationship between connected nodes.
chart.edges().tooltip().format("{%from} owns {%to}");This tooltip configuration helps to clarify the connections within the graph, showing direct ownership or affiliation between the parent company and its subsidiaries, enhancing the user’s comprehension and interaction with the graph.
Customizing Node Appearance
Visual differentiation helps to quickly identify types of nodes. We can customize the appearance of nodes based on their group classification, such as distinguishing between the core company, child companies, and products.
// 1) configure settings for nodes representing the core company
chart.group('CoreCompany')
  .stroke('none')
  .height(45)
  .fill('red')
  .labels().fontSize(15);
// 2) configure settings for nodes representing child companies
chart.group('ChildCompany')
  .stroke('none')
  .height(25)
  .labels().fontSize(12);
// 3) configure settings for nodes representing products
chart.group('Product')
  .shape('square')
  .stroke('black', 1)
  .height(15)
  .labels().enabled(false);
These settings enhance the visual hierarchy of the graph. The core company node is more prominent, child companies are easily distinguishable, and product nodes are less emphasized but clearly structured, aiding in the quick visual processing of the graph’s structure.
Setting Chart Title
Adding a title to the chart provides context and introduces the visual content. It’s a simple but effective way to inform viewers about the purpose of the network graph.
chart.title("Volkswagen Group Network");The title “Volkswagen Group Network” immediately informs the viewer of the graph’s focus, adding a professional touch and enhancing the overall clarity.
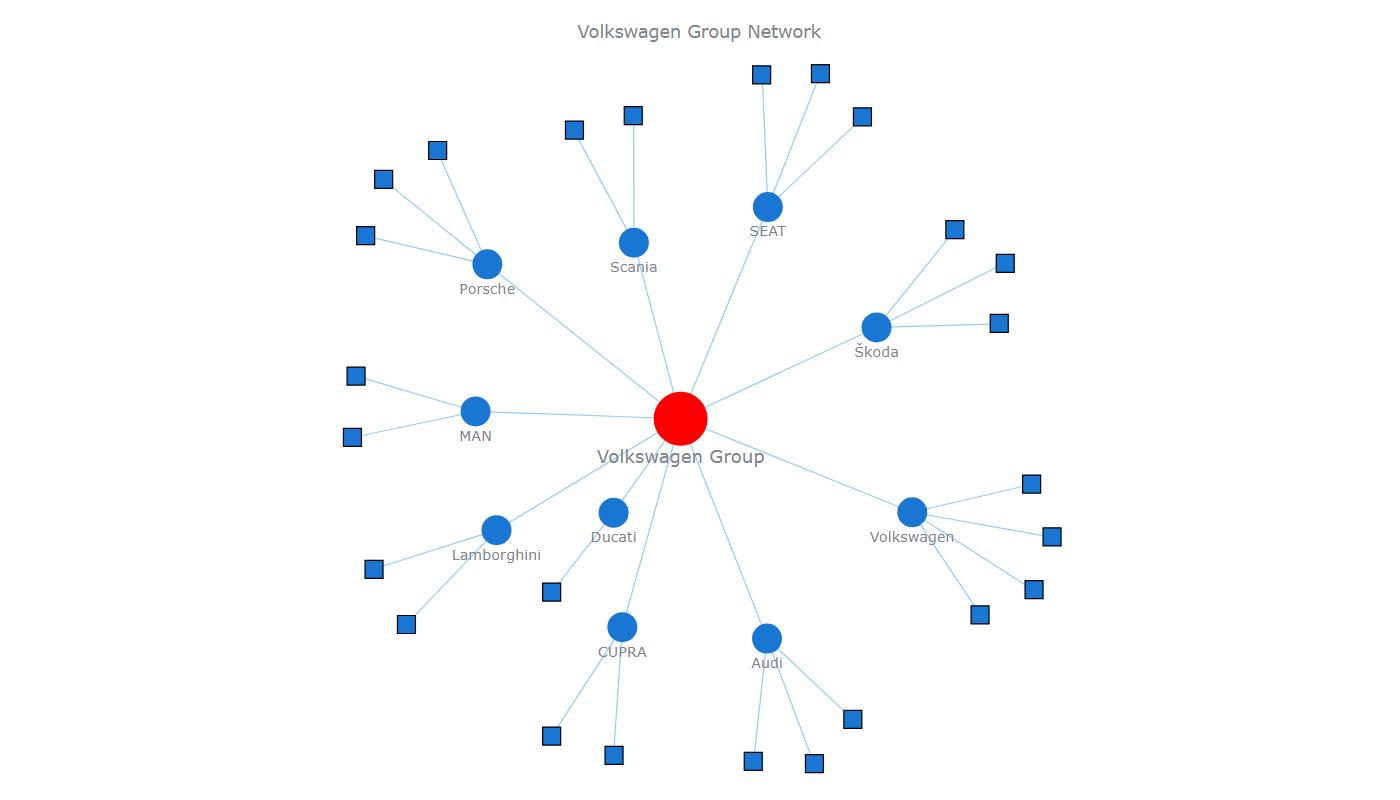
Final Network Graph Visualization
With these customizations, our network graph is now a detailed and interactive visualization, ready for in-depth exploration. Below is the complete code incorporating all the enhancements discussed. This version of the JS-based network graph is not only a tool for displaying static data but also a dynamic map of the Volkswagen Group’s complex structure.
I invite you to view and interact with this chart on the AnyChart Playground to see it in action and to tweak the code further to suit your specific needs. For your convenience, the full network graph code is also provided below:
<html>
  <head>
    <title>Network Graph in JavaScript</title>
    <style type="text/css">
      html, body, #container {
        width: 100%; height: 100%; margin: 0; padding: 0;
      }
    </style>
    <script src="https://cdn.anychart.com/releases/8.12.1/js/anychart-core.min.js"></script>
    <script src="https://cdn.anychart.com/releases/8.12.1/js/anychart-graph.min.js"></script>
  </head>
  <body>
    <div id="container"></div>
    <script>
      anychart.onDocumentReady(function () {
        // Create data
        const data = {
          "nodes": [
            // parent company
            {"id": "Volkswagen Group", "group": "CoreCompany"},
            // child companies
            {"id": "Audi", "group": "ChildCompany"},
            {"id": "CUPRA", "group": "ChildCompany"},
            {"id": "Ducati", "group": "ChildCompany"},
            {"id": "Lamborghini", "group": "ChildCompany"},
            {"id": "MAN", "group": "ChildCompany"},
            {"id": "Porsche", "group": "ChildCompany"},
            {"id": "Scania", "group": "ChildCompany"},
            {"id": "SEAT", "group": "ChildCompany"},
            {"id": "Škoda", "group": "ChildCompany"},
            {"id": "Volkswagen", "group": "ChildCompany"},
            // products
            {"id": "Audi Cars", "group": "Product"},
            {"id": "Audi SUVs", "group": "Product"},
            {"id": "Audi Electric Vehicles", "group": "Product"},
            {"id": "CUPRA Performance Cars", "group": "Product"},
            {"id": "CUPRA SUVs", "group": "Product"},
            {"id": "Ducati Motorcycles", "group": "Product"},
            {"id": "Lamborghini Sports Cars", "group": "Product"},
            {"id": "Lamborghini SUVs", "group": "Product"},
            {"id": "MAN Trucks", "group": "Product"},
            {"id": "MAN Buses", "group": "Product"},
            {"id": "Porsche Sports Cars", "group": "Product"},
            {"id": "Porsche SUVs", "group": "Product"},
            {"id": "Porsche Sedans", "group": "Product"},
            {"id": "Scania Trucks", "group": "Product"},
            {"id": "Scania Buses", "group": "Product"},
            {"id": "SEAT Cars", "group": "Product"},
            {"id": "SEAT SUVs", "group": "Product"},
            {"id": "SEAT Electric Vehicles", "group": "Product"},
            {"id": "Škoda Cars", "group": "Product"},
            {"id": "Škoda SUVs", "group": "Product"},
            {"id": "Škoda Electric Vehicles", "group": "Product"},
            {"id": "Volkswagen Cars", "group": "Product"},
            {"id": "Volkswagen SUVs", "group": "Product"},
            {"id": "Volkswagen Vans", "group": "Product"},
            {"id": "Volkswagen Trucks", "group": "Product"}
            ],
          "edges": [
            // parent to child companies
            {"from": "Volkswagen Group", "to": "Audi"},
            {"from": "Volkswagen Group", "to": "CUPRA"},
            {"from": "Volkswagen Group", "to": "Ducati"},
            {"from": "Volkswagen Group", "to": "Lamborghini"},
            {"from": "Volkswagen Group", "to": "MAN"},
            {"from": "Volkswagen Group", "to": "Porsche"},
            {"from": "Volkswagen Group", "to": "Scania"},
            {"from": "Volkswagen Group", "to": "SEAT"},
            {"from": "Volkswagen Group", "to": "Škoda"},
            {"from": "Volkswagen Group", "to": "Volkswagen"},
            // child companies to products
            {"from": "Audi", "to": "Audi Cars"},
            {"from": "Audi", "to": "Audi SUVs"},
            {"from": "Audi", "to": "Audi Electric Vehicles"},
            {"from": "CUPRA", "to": "CUPRA Performance Cars"},
            {"from": "CUPRA", "to": "CUPRA SUVs"},
            {"from": "Ducati", "to": "Ducati Motorcycles"},
            {"from": "Lamborghini", "to": "Lamborghini Sports Cars"},
            {"from": "Lamborghini", "to": "Lamborghini SUVs"},
            {"from": "MAN", "to": "MAN Trucks"},
            {"from": "MAN", "to": "MAN Buses"},
            {"from": "Porsche", "to": "Porsche Sports Cars"},
            {"from": "Porsche", "to": "Porsche SUVs"},
            {"from": "Porsche", "to": "Porsche Sedans"},
            {"from": "Scania", "to": "Scania Trucks"},
            {"from": "Scania", "to": "Scania Buses"},
            {"from": "SEAT", "to": "SEAT Cars"},
            {"from": "SEAT", "to": "SEAT SUVs"},
            {"from": "SEAT", "to": "SEAT Electric Vehicles"},
            {"from": "Škoda", "to": "Škoda Cars"},
            {"from": "Škoda", "to": "Škoda SUVs"},
            {"from": "Škoda", "to": "Škoda Electric Vehicles"},
            {"from": "Volkswagen", "to": "Volkswagen Cars"},
            {"from": "Volkswagen", "to": "Volkswagen SUVs"},
            {"from": "Volkswagen", "to": "Volkswagen Vans"},
            {"from": "Volkswagen", "to": "Volkswagen Trucks"}
          ]};
        // Initialize the network graph with the provided data structure
        const chart = anychart.graph(data);
        // Customization step #1:
        // display chart node labels
        chart.nodes().labels().enabled(true);
        // Customization step #2:
        // configure edge tooltips
        chart.edges().tooltip().format("{%from} owns {%to}");
        // Customization step #3:
        // customizing node appearance:
        // 1) configure settings for nodes representing the core company
        chart.group('CoreCompany')
          .stroke('none')
          .height(45)
          .fill('red')
          .labels().fontSize(15);
        // 2) configure settings for nodes representing child companies
        chart.group('ChildCompany')
          .stroke('none')
          .height(25)
          .labels().fontSize(12);
        // 3) configure settings for nodes representing products
        chart.group('Product')
          .shape('square')
          .stroke('black', 1)
          .height(15)
          .labels().enabled(false);
        // Customization step #4:
        // set the title of the chart for context
        chart.title("Volkswagen Group Network");
        // Specify the HTML container ID where the chart will be rendered
        chart.container("container");
        // Initiate the rendering of the chart
        chart.draw();
      });
    </script>
  </body>
</html>
Conclusion
Congratulations on completing this tutorial on crafting a dynamic JavaScript network graph! You’ve not only learned to visualize complex structures but also how to customize the graph to enhance its clarity and interactivity.
As you continue to explore the possibilities within network graph visualizations, I encourage you to delve deeper, experiment with further customization, and look for some inspiring chart examples out there.
The skills you’ve acquired today are just the beginning. Keep experimenting, tweaking, and learning to unlock the full potential of data visualization in your projects. Happy charting!
Published with permission of Alex Carter. Originally appeared on DZone under the title “How To Create a Network Graph Using JavaScript” on May 22, 2024.
To further hone your new skills, check out the Network Graph Tutorial originally published on our blog earlier, visualizing the Solar System network step by step.
Explore more JavaScript charting tutorials and continue improving your interactive data visualization expertise.
Have an idea for a guest post or want to repost your article featuring AnyChart published elsewhere? Just contact us.
- Categories: AnyChart Charting Component, Big Data, HTML5, JavaScript, JavaScript Chart Tutorials, Tips and Tricks
- No Comments »