 Join us to check out the most awesome data visualizations of all we have come across this week! To begin with, here is a full list of the projects featured today in DataViz Weekly:
- Proposed and passed voting bills across the U.S. in 2021 — Bloomberg
- Change in birth rates among American women — NYT
- Billing practices at the top 100 U.S. hospitals — Axios
- Transit equity in major U.S. cities — TransitCenter
Data Visualization Weekly: June 18, 2021 — June 25, 2021
Proposed and Passed Voting Bills Across U.S. in 2021
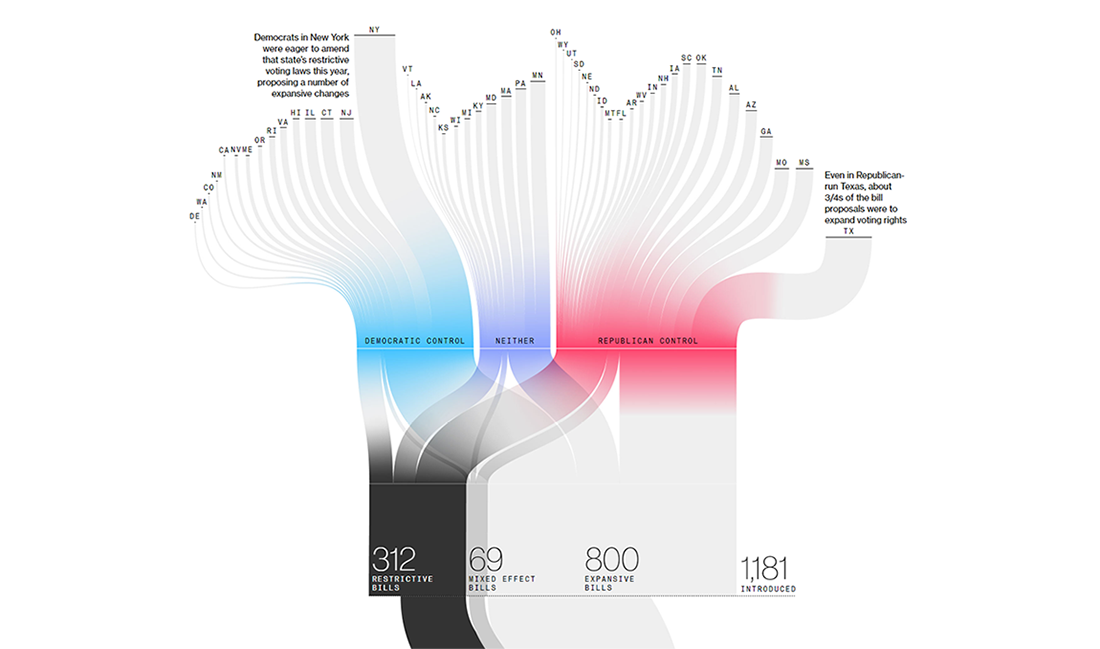
Since the beginning of the year 2021, U.S. state legislators have proposed a total of over a thousand bills regarding voting rules. Republicans were mostly seen as trying to tighten the rules and add hassle at polls. Democrats, on the contrary, focused on facilitating the voting procedures.
Bloomberg divided all the proposals into three categories based on effects on voting rights — restrictive, expansive, and mixed — and made visualizations for an easy overview. A Sankey diagram, for example, is greatly used to display the path of the introduced 1,181 bills down to the signed 49. A cartogram represents the breakdown of the proposals by category in each state.
Further down the article by Ryan Teague Beckwith, Allison McCartney, and Mira Rojanasakul, you can find out what measures were enacted or passed where according to the bill subject categories from the Brennan Center. Scatter diagrams showing the change in win margins against the change in voter turnout for the last five U.S. presidential elections suggest that the new laws hardly create any substantial partisan advantage.
Change in Birth Rates Among American Women
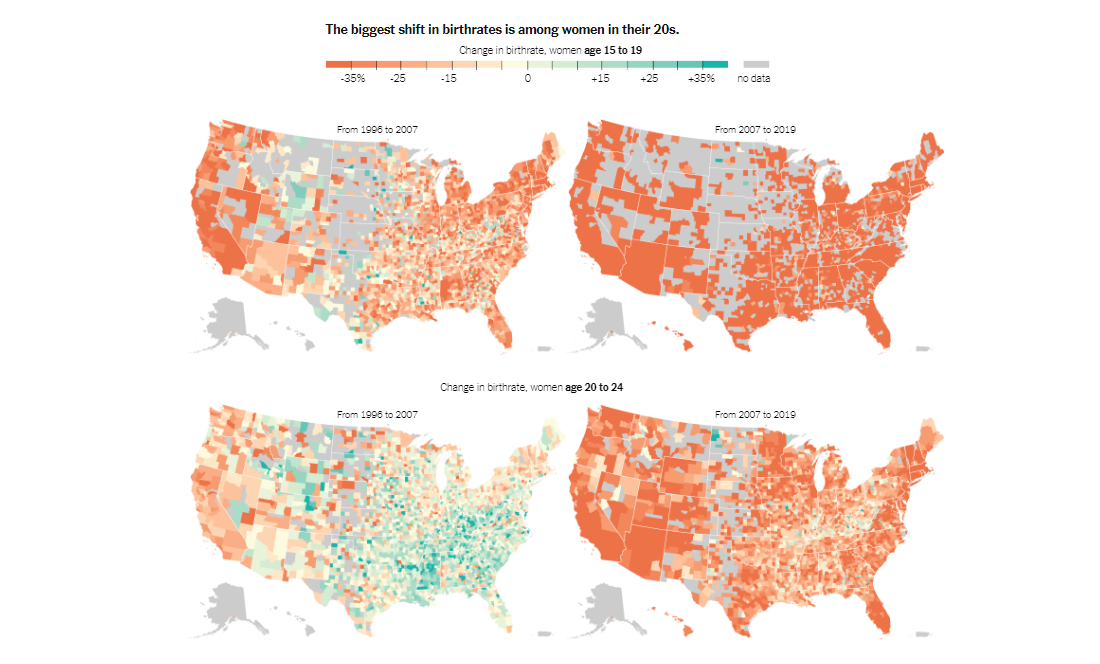
Birth rates are down almost everywhere across the United States. The reason is now more American women than ever prioritize education and career. The biggest decline in childbearing has been noticed for women under 30 and in places with the highest job growth, according to the findings from the recent analysis of birth rates carried out by Caitlin Myers, a professor of economics at Middlebury College.
The New York Times visualized Myers’s data on the change in birth rates at the county level. Check out the first map to understand how they changed (mostly grew) during the period 1996-2007 and the second map showing shifts (mostly decreases) from 2007 to 2019, for all women aged 15-44. Then, take a look at the situation within specific age groups: 15-19, 20-24, 25-29, 30-34, 35-39, and 40-44.
Explore the trends using these interesting maps and see what they may mean for the future, in the story by Sabrina Tavernise, Claire Cain Miller, Quoctrung Bui, and Robert Gebeloff.
Billing Practices at Top 100 U.S. Hospitals
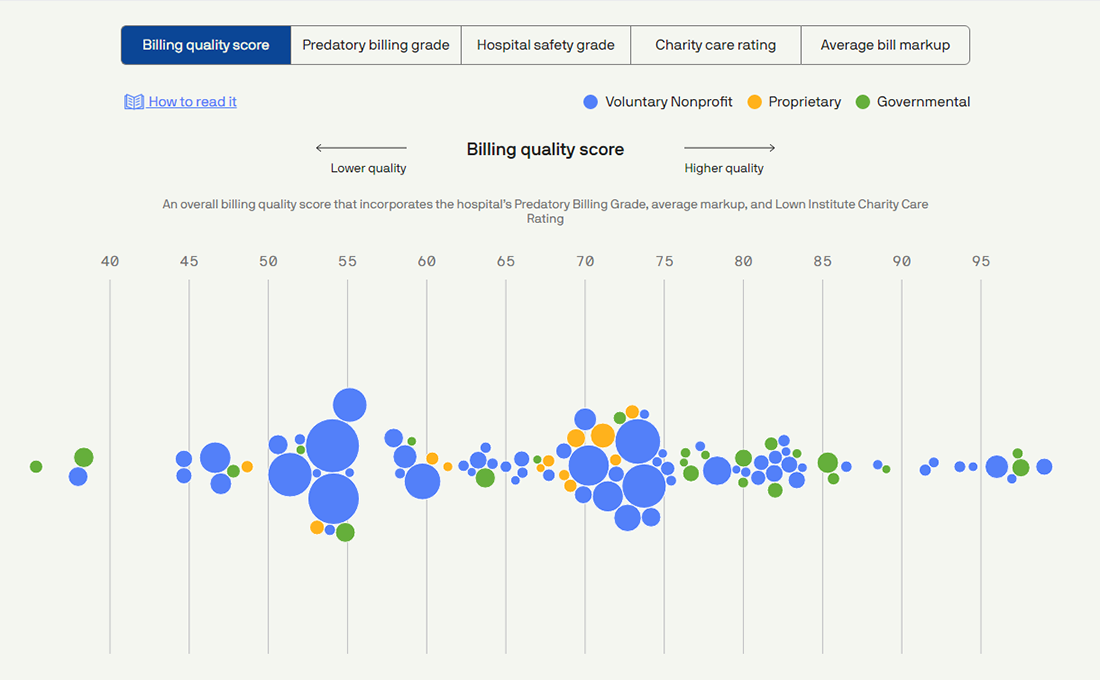
Recently, a group of researchers from the Johns Hopkins University, lead by Marty Makary, collected data about billing in the top 100 U.S. hospitals (by revenue) for the period from January 1, 2018, through July 31, 2020. The analysis revealed several interesting findings. For example, on average, the top 100 hospitals charged patients seven times the cost of service. Private ones had an average markup of 12x. Then they pursued patients who could not afford to pay.
Michelle McGhee and Will Chase from Axios created an interactive visualization tool providing a simple way to explore the data about, as they put it, “predatory billing” tactics and practices of America’s most earning hospitals. Each bubble in the chart represents one hospital, with size indicating revenue and color showing tax status (green for governmental, orange for proprietary, and blue for non-profit institutions).
Switch between the five available views to look at what you want to analyze: billing quality scores, predatory billing scores, hospital safety grades, community benefit ratings, and average bill markups. Hover over a bubble to see the details about the corresponding hospital and click to locate it in the data table.
Transit Equity in Major U.S. Cities
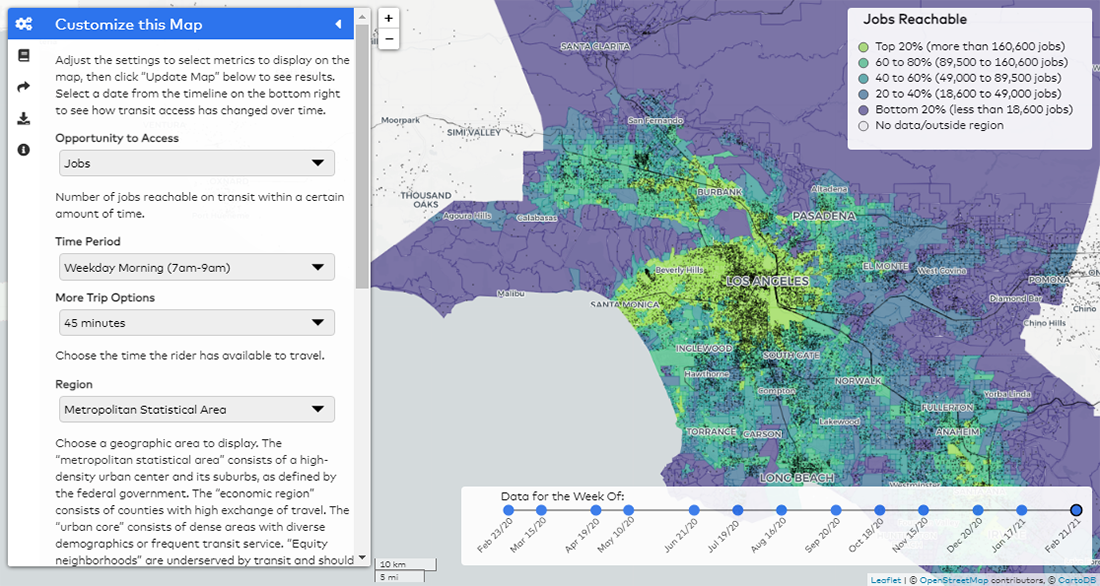
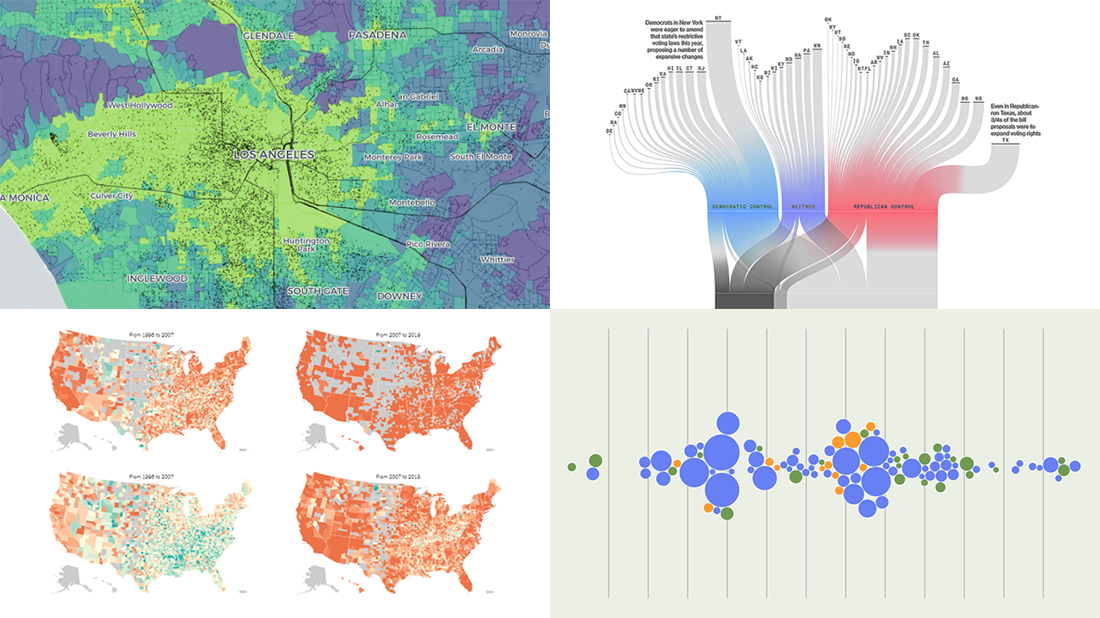
The average resident of the Greater Los Angeles Area can reach 17 times more jobs by car than using public transport. For the average Black resident of New York City, 45% fewer jobs are reachable in a 45-minute transit trip than for the average White resident. In Washington, DC, it takes over three times more time to get to the nearest hospital by transit than by driving. Generally, in major U.S. cities, far more jobs are reachable using a car than using public transport, and white residents are less likely to commute by transit than people of color.
These are just a few of the findings revealed by the impressive Transit Equity Dashboard just launched by TransitCenter. Measuring the economic and racial disparities in transit access, the project is designed to help policymakers and professionals in the field of public transportation make informed decisions based on clear metrics of the existing gaps and on a better understanding of how changes to transit networks affect the situation here and there.
Currently, the dashboard provides an interactive overview of the state of transit equity in Chicago, Los Angeles, New York, Philadelphia, San Francisco Bay Area, and Washington, DC, displaying data on the reachability of jobs, groceries, parks, hospitals, and colleges within a certain amount of time. A map for Boston is on the way.
***
We appreciate your attention! Thanks for staying tuned for Data Visualization Weekly!
- Categories: Data Visualization Weekly
- No Comments »