 Continuing our DataViz Weekly series, we’ve put together a fresh selection of cool new charts and maps that are worth looking at and exploring. The visualizations we feature this time provide interesting insight into the following topics:
- Economic recessions worldwide in 1960-2019 — Business Insider
- Football divide in Berlin — Berliner Morgenpost
- Earthquake scenarios for California landmarks — Los Angeles Times
- Decline in the global vegetation growth — Science Advances
New Charts and Maps in Data Visualization Weekly: August 16, 2019 — August 23, 2019
Economic Recessions Worldwide in 1960-2019
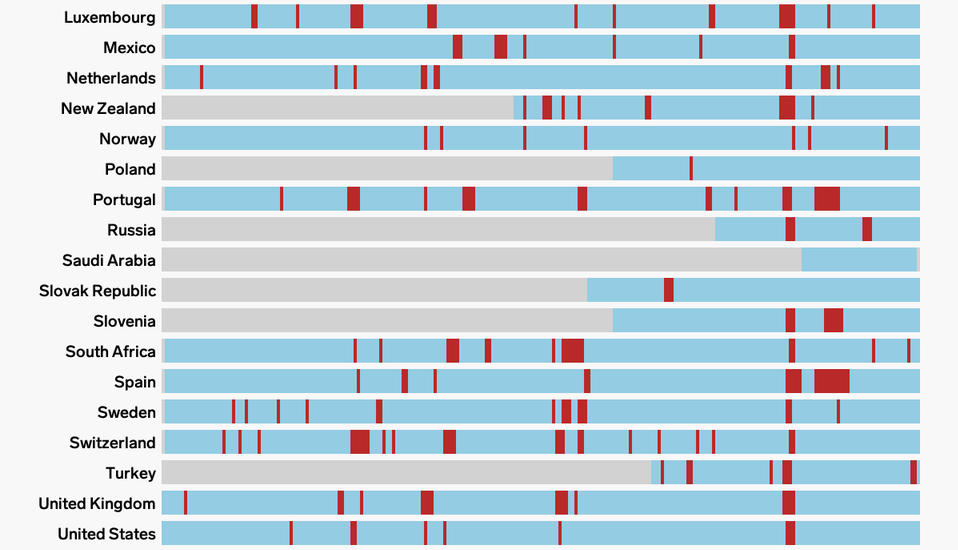
Following a big recession warning the United States has recently got, Business Insider‘s senior quant reporter Andy Kiersz looked into the history of recessions in the U.S. and worldwide. In particular, he created a chart that neatly displays technical recessions in 1960-2019 — for each country that has been tracked in the OECD’s Quarterly Growth Rates of Real GDP database.
In this look, a recession is determined as 2 (and more) consecutive quarters of negative real GDP growth.
See the entire chart on Business Insider to understand when and where technical recessions have taken place around the world over the past 60 years.
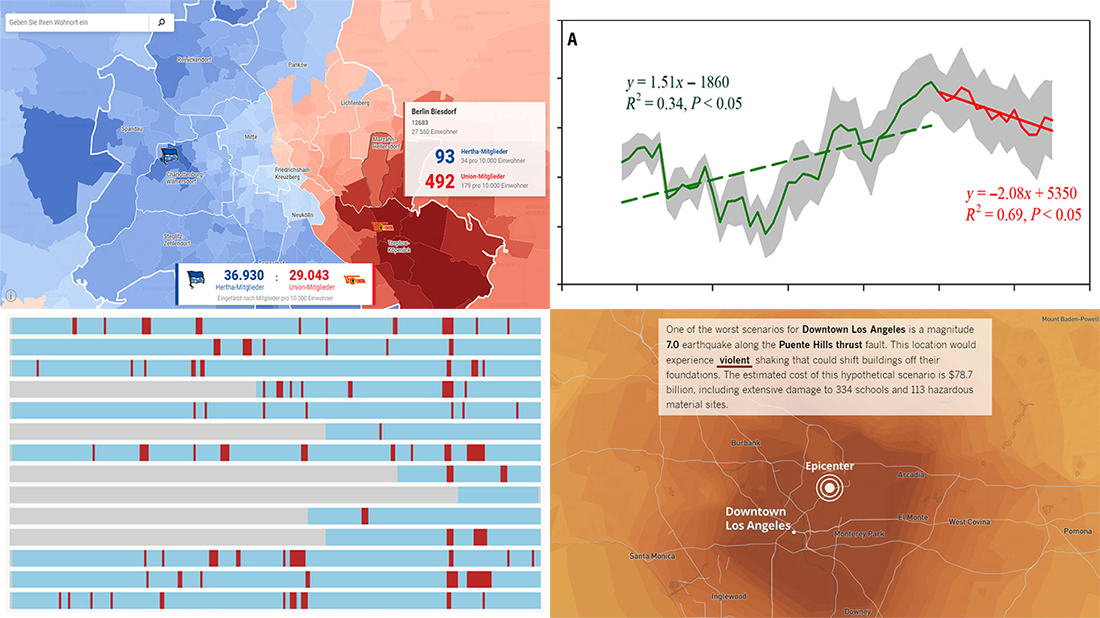
Football Divide in Berlin
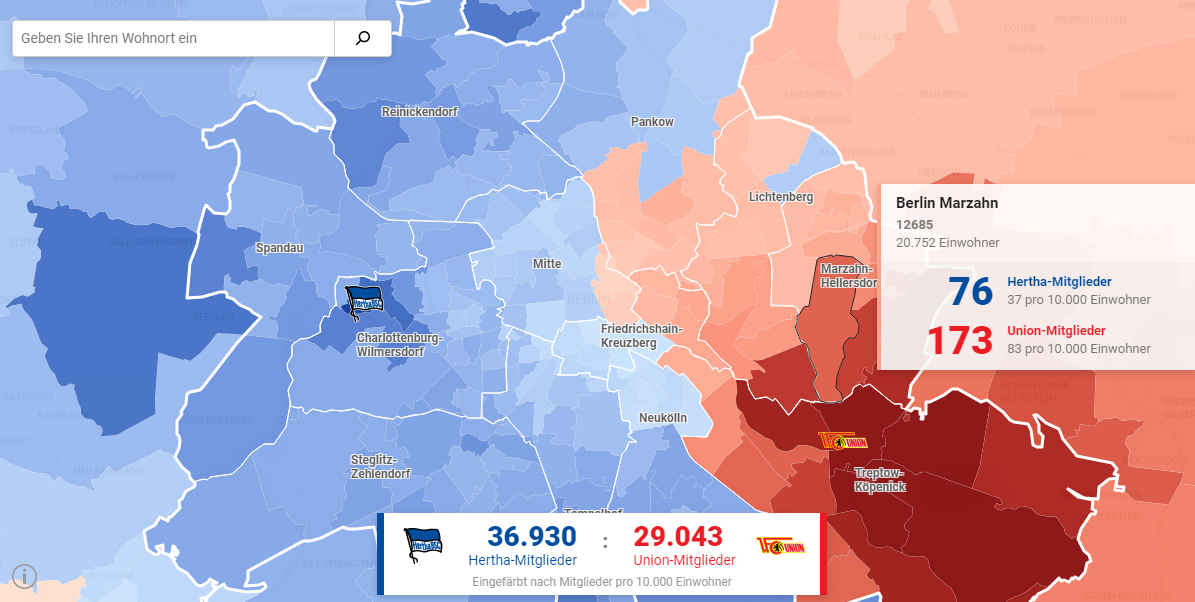
Berliner Morgenpost visualized on an interactive map how Berlin is divided by football team preferences into two clearly recognizable halves. This has become actual as the new, 2019-20 season is the first time in history when two teams represent Berlin in the Bundesliga, Germany’s main football competition — Hertha BSC and FC Union Berlin.
The authors chose to show the divide based on the number of paid-up members as obviously the most loyal fans, using anonymized data from the two clubs.
Check out the map from Berliner Morgenpost to study the current football-driven divide of Berlin.
Earthquake Scenarios for California Landmarks
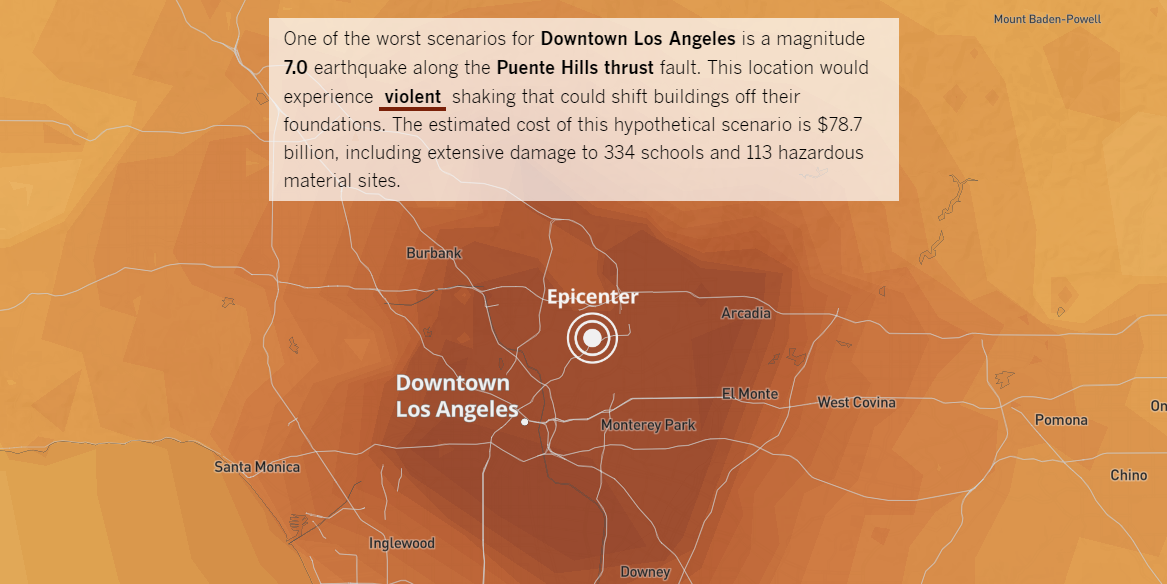
Scientists at the United States Geological Survey (USGS) compose a lot of diverse scenarios of earthquakes to enable and further facilitate proper emergency planning. The Los Angeles Times‘ Zach Levitt and Rong-Gong Lin II worked with several of the USGS experts to pick 14 significant models for earthquakes potentially coming from faults across California and visualize on a map what would happen in each case.
Look at the map. Here you can search for any address in California to find out what scenario can lead to the most serious shaking in that area and what it is likely to feel like.
Earth Vegetation Growth Decline
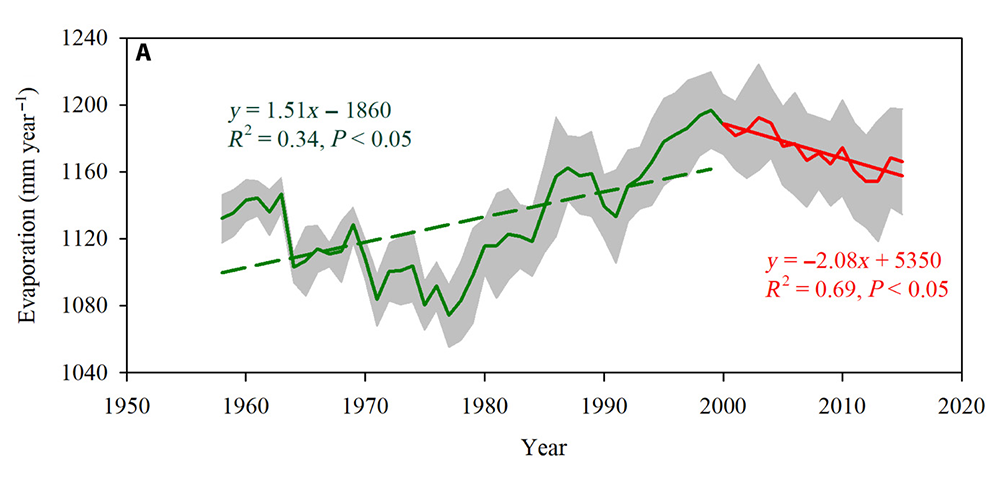
Science Advances published a study of an international group of researchers, which revealed that the world stopped getting greener about twenty years ago. According to this new research, climate change and global warming are to blame for that as they have been causing the increasing deficit of atmospheric vapor pressure which is actually linked to the decline in the global vegetation growth.
There are a lot of charts and maps in the study. The data visualizations and the research article might look quite complicated at first glance but they are worth checking out if you want to look into this matter.
***
Did you like our selection of new charts and maps? Awesome! Stay tuned for Data Visualization Weekly — we publish such digests on our blog each Friday.
Have a great time, everyone!
- Categories: Data Visualization Weekly
- No Comments »