 We at AnyChart are proud to announce the 8.3.0 release of our JS chart libraries AnyChart, AnyStock, AnyGantt, and AnyMap! The present major update brings full support of HTML in tooltips, background settings for chart data bounds, coloring rules and thresholds, easy axis label positioning, new technical indicators, and even more.
New JS Chart Features in AnyChart 8.3.0
 |
HTML Tooltips SupportTooltip customization is way easier now! Full support of HTML is available in all of our JavaScript charting libraries: AnyChart, AnyMap, AnyGantt, and AnyStock. You can write your own HTML code and customize tooltip visualization using CSS classes. Read how to add an HTML tooltip, and check out a chart with HTML tooltips in the gallery. |
 |
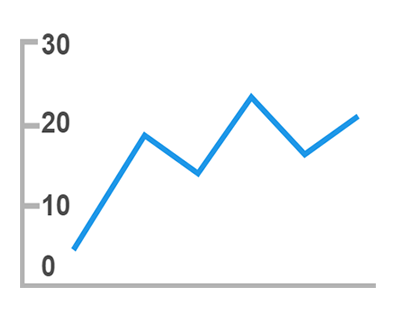
Background Settings for Chart Data BoundsThe background can be changed for the data area if needed — in basic JS charts (AnyChart) and JS maps (AnyMap). See the data area background documentation and a chart with background settings for chart data bounds. |
 |
Coloring Rules and ThresholdsNew ways to customize the coloring of series are added to basic and stock charts, i.e. AnyChart and AnyStock: negative/positive colors, rising/falling colors, and the ability to specify the Color Scale with thresholds for series. Read about automatic coloring in AnyChart Docs. Take a look at multiple chart examples using coloring rules and thresholds in our gallery. |
 |
Axis Label PositioningThe positioning of axis labels inside data plots in basic charts (AnyChart) and stock charts (AnyStock) gets easier. Learn more about the axis label positioning in our documentation and check out a chart example with the axis label positioning in action. |
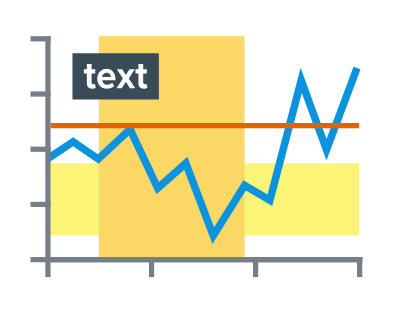 |
Axis MarkersAxis Markers are now added to AnyStock: Text Marker, Line Marker, and Range Marker. See the Axes in AnyStock documentation to find out the details. |
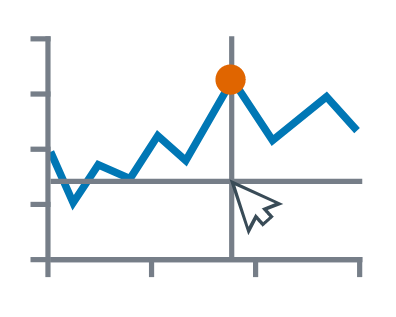 |
Hover State ConfigurationHovered state configuration is now supported in stock and financial JS charts powered by our dedicated AnyStock library. Look at our stock chart example featuring markers on hover for illustration. |
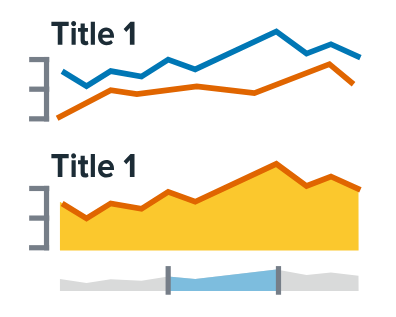 |
Plot TitlesStock chart plots can have their own titles now. Read about chart plot titles in AnyStock in the documentation and check out the stock chart plot title demo in the gallery. |
 |
New Technical IndicatorsSeven new out-of-the-box technical indicators are now available in AnyStock JS library: TRIX, Keltner Channel, On Balance Volume (OBV), Awesome Oscillator (AO), Heikin Ashi, VolumeMA, and Price Channels. You’ll find the corresponding stock chart examples in the Technical Indicators gallery. |
 |
Gantt Editing API ImprovementsGantt charts editing API is thoroughly revised and improved. Here’s a Gantt chart example leveraging the updated API. |
More Improvements
That’s not even all the awesome news of AnyChart JS Charts 8.3.0. As always, not only have we added a bunch of cool features to our HTML5-based data visualization libraries, but there are also multiple further important improvements and bug fixes.
Check out the version histories to find out what else is new:
- AnyChart version history;
- AnyStock version history.
- AnyGantt version history;
- AnyMap version history.
***
Thanks for choosing AnyChart’s JS chart libraries — recognized the best in JavaScript technology this year! — to operate interactive data visualization in your web apps and other projects. Feel free to ping us with your feedback about the 8.3.0 release as well as with new charting feature suggestions — on Twitter, Facebook, LinkedIn, or by contacting our Support Team.
Enjoy AnyChart JS Charts 8.3.0!
- Categories: AnyChart Charting Component, AnyGantt, AnyMap, AnyStock, Financial Charts, Gantt Chart, HTML5, JavaScript, News, Stock Charts
- 6 Comments »
Comments (6)
For trial purpose
Free trial is fully functional, download from here:
https://www.anychart.com/download/