 We are surrounded by data, but making sense of it is not always straightforward. Graphics can serve as a lens, helping key patterns and implications come through more clearly. We have selected several interesting projects from around the web that caught our attention these days, capturing how data visualization can be effectively put to work. See what’s on DataViz Weekly today:
- Longer summers across the United States — The Washington Post
- Workforce cuts at U.S. health agencies — ProPublica
- Grid stability in renewable-rich systems — Bloomberg Green
- Toronto parking land and housing potential — School of Cities
Data Visualization Weekly: August 22–29, 2025
Longer Summers Across the United States
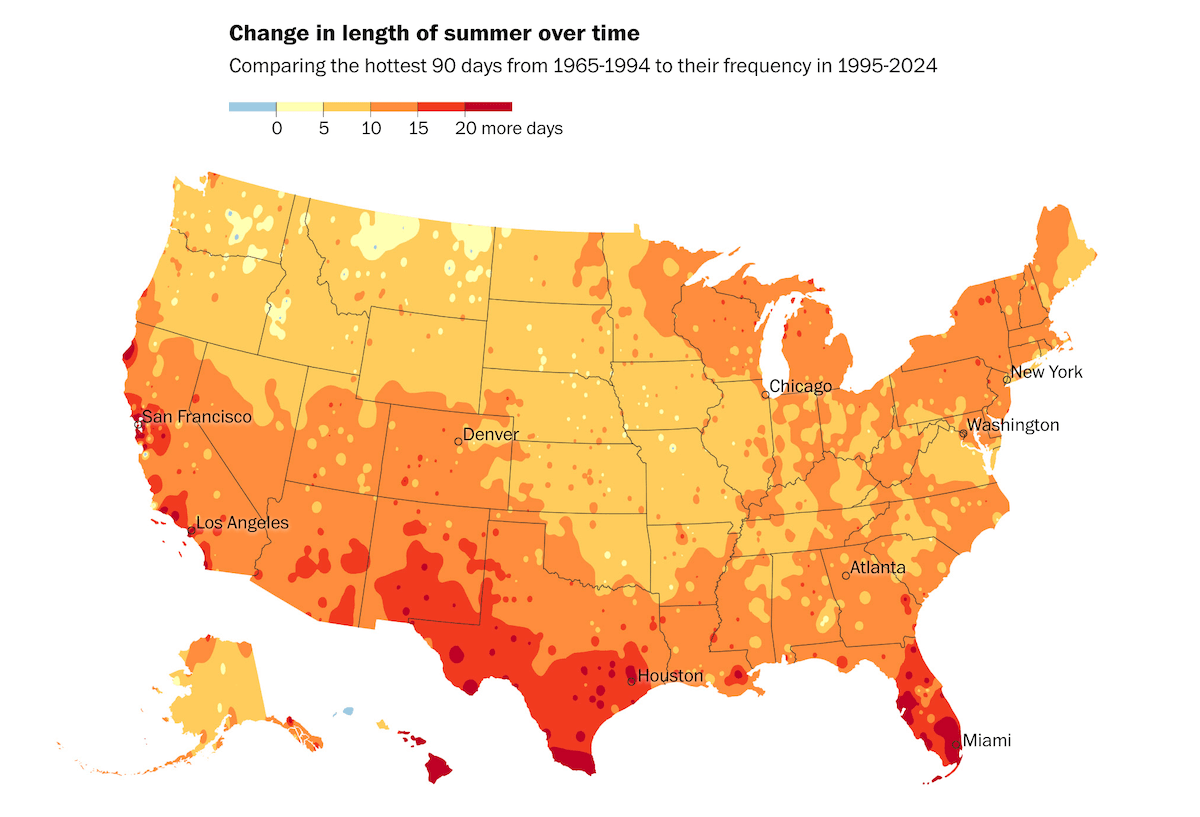
Summer heat is no longer confined to the traditional summer months. Across the country, high temperatures are arriving earlier and lingering later, reshaping how people experience the season compared with three decades ago.
The Washington Post illustrates this trend with a U.S. map showing how the hottest 90 days of the year have shifted between 1965–1994 and 1995–2024. A supporting chart highlights the cities with the greatest increase in summer days, including places where the season has stretched by weeks. Drawing on climatologist Brian Brettschneider’s analysis, the piece reveals how rising global temperatures and warming oceans are lengthening summer across much of the United States, while also pointing out a few areas where the change has been modest or even reversed.
See the story on The Washington Post, by Kasha Patel and Naema Ahmed.
Workforce Cuts at U.S. Health Agencies
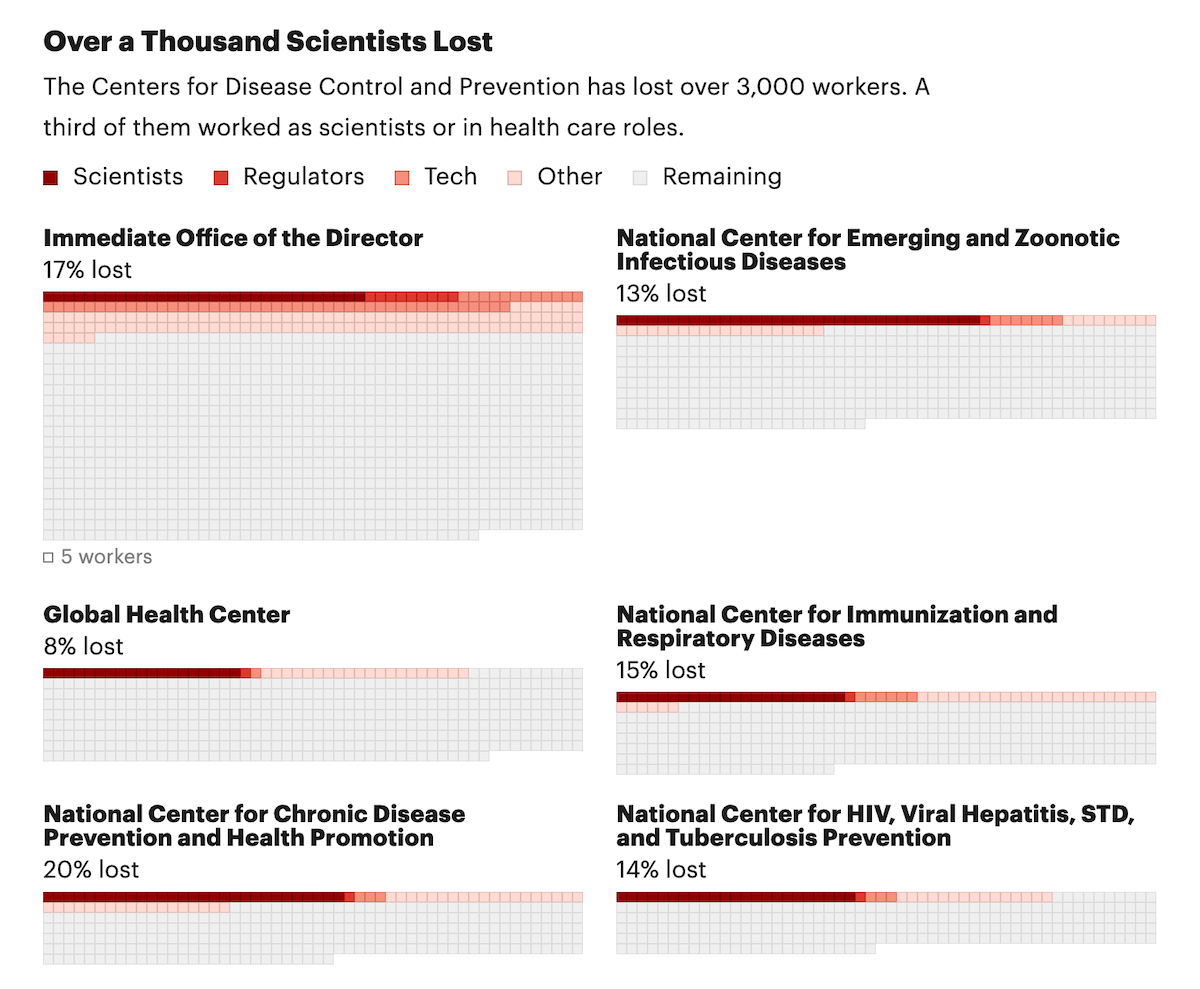
A sweeping reduction in the federal public health workforce has reshaped the Department of Health and Human Services in recent months. Thousands of scientists, regulators, and support staff have left or been forced out, raising questions about how agencies can continue to meet their core responsibilities.
ProPublica visualizes the impact with a step area chart showing cumulative workforce losses month by month from January through August 2025. A series of unit charts then provides a closer look: the first depicts all of HHS, then the focus shifts to the Food and Drug Administration, the Centers for Disease Control and Prevention, and the National Institutes of Health. Each of these agencies is accompanied by further unit charts that break down losses within their divisions, illustrating how reductions are distributed across critical parts of the public health system.
Explore the article on ProPublica, by Brandon Roberts, Annie Waldman, and Pratheek Rebala.
Grid Stability in Renewable-Rich Systems
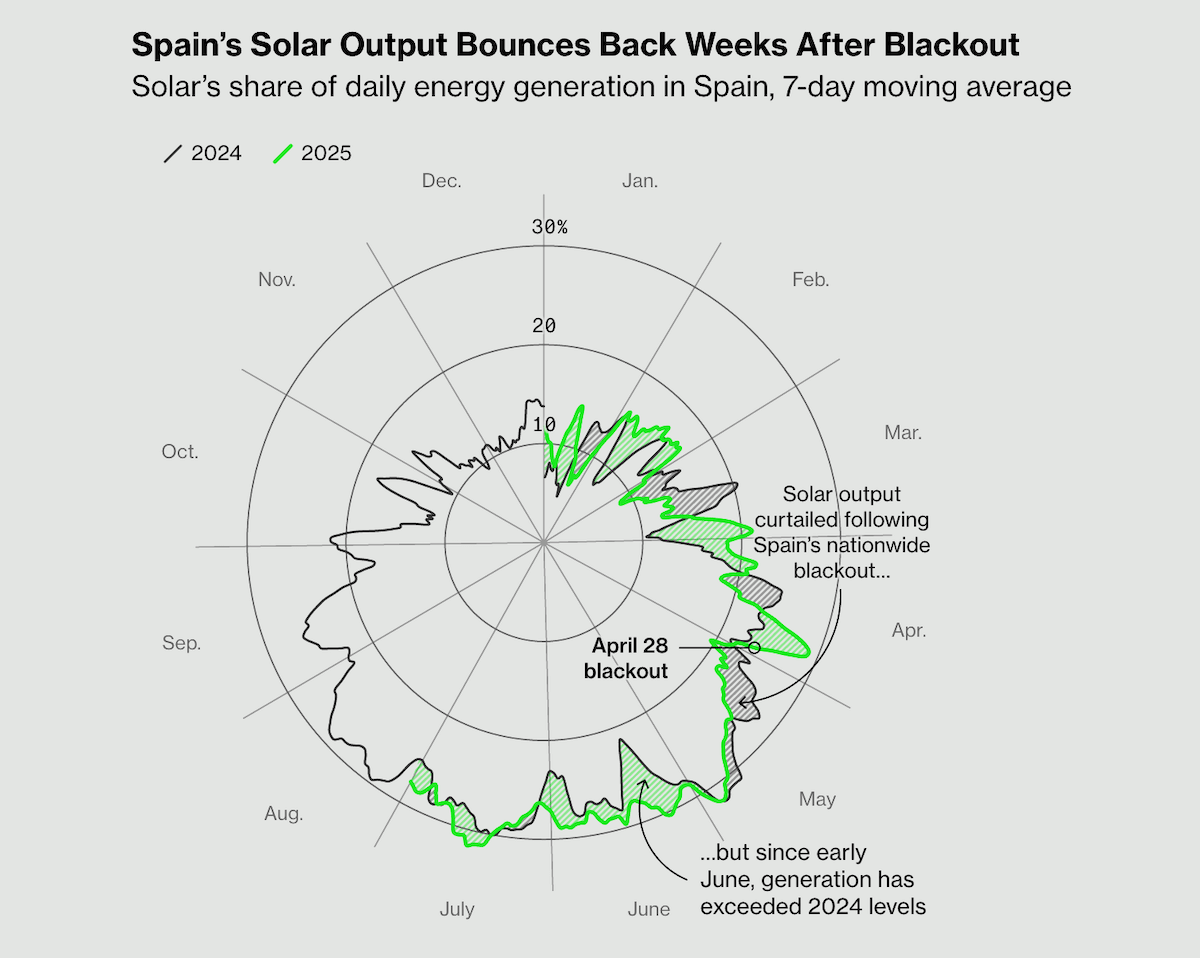
As renewable energy expands, ensuring stable electricity networks has become a critical challenge. Blackouts linked to solar and wind highlight how grids need technologies that can balance fluctuations and keep power flowing.
Bloomberg examines this issue and the fixes now being put in place, presenting the story with a range of visualizations. One key chart, shown above, is a polar plot tracking Spain’s solar share of daily generation in 2024 and 2025. Additional graphics include combo charts with line and stacked area series comparing installed renewable and fossil capacity in Australia, the UK, and Spain with Portugal, spanning historical data since 2000 and projections through 2030. A bubble chart adds the perspective of grid investment, while technical schematics and illustrations further explain how stabilizing technologies work.
Check out the piece on Bloomberg Green, by Akshat Rathi and Laura Millan, with graphics by Tom Fevrier and Hayley Warren.
Toronto Parking Land and Housing Potential
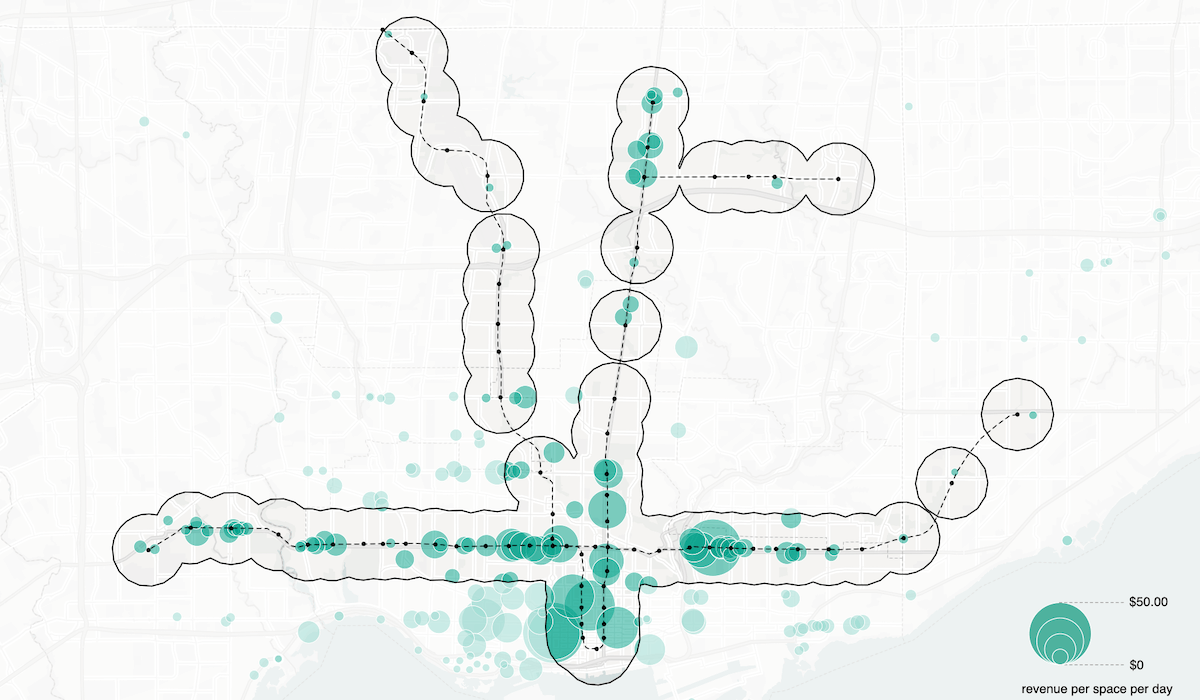
Across Toronto, surface parking lots cover more than 9% of the city’s land. With housing needs pressing, these underused sites may present an opportunity to create new homes and boost the city’s revenue base.
The University of Toronto’s School of Cities explores the scale and potential through an interactive story map. It shows how much land is tied up in parking, pinpoints City-owned (Green P) lots, visualizes per-space daily revenue, and overlays proximity to transit. Case studies from CreateTO show what happens when specific lots are redeveloped into housing, with comparisons of property value assessments before and after illustrating the financial and social gains.
Take a look at the project on the School of Cities website, by Scott McCallum, Jeff Allen, and Mischa Young.
Wrapping Up
From climate trends and government workforce changes to the stability of renewable grids and urban land use, visualization helps reveal where challenges and opportunities lie. The four projects featured here show how data graphics like maps and charts of different types can make complex topics easier to grasp and discuss.
Stay tuned for more examples of data visualization at work — and if you are creating your own projects, we would love to see them for possible inclusion in an upcoming edition.
- Categories: Data Visualization Weekly
- No Comments »