 When data is all around, it’s no wonder to see charts here or there as they greatly help make sense of it. With thousands of happy customers worldwide, both for our JS charting library and Qlik charting extensions, we have seen countless applications for data visualization across all fields and industries. Some use cases, however, might be less expected than others. What about a website dedicated to literature?
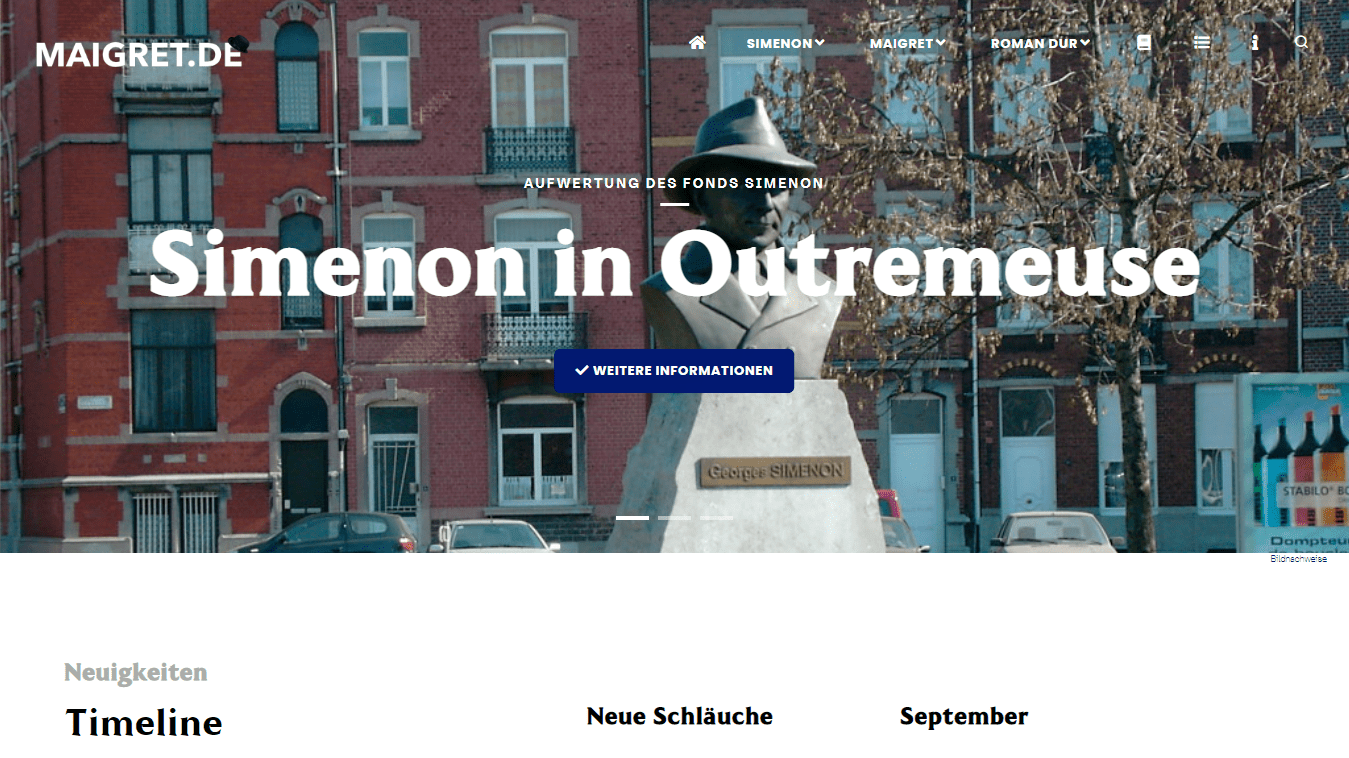
Maigret.de — a remarkable resource about Georges Simenon, a famous Belgian writer best known for creating police detective Jules Maigret — has recently started to publish interactive data graphics revealing interesting patterns and facts in his immense work. All the charts on the website are built with AnyChart.
We have chatted with Maigret.de’s creator Oliver Hahn about his project, data visualizations, and experience using our solutions. Read the quick interview and go check out the website. (Stack: HTML/MySQL.)
AnyChart: Hi Oliver! First of all, let’s introduce you to our community. Could you please say a few words about yourself and what you do?
Oliver Hahn: Hi, my name is Oliver Hahn, and I live in a small village between Hamburg and Kiel. My main job is IT consultant and product manager in a company that offers solutions for media. I have been running the website Maigret.de, which deals with the work and life of Georges Simenon, for about 25 years. A special focus is on his Inspector Maigret.
A: So, how did it all start? When did you create Maigret.de and why?
OH: It was around 1995–1996 — a wild time if you look at the homepage archives. It was very colorful, a lot of things were moving, and we only had 256 colors. But I didn’t want to create one of those “Oops, now I’m on the internet” websites that were common at the time. I had a little more content in mind, and so I started writing about the subject of Maigret. I combined the pleasant (one of my favorite literary characters) with the useful — learning HTML.
After the first descriptions were online, a particular ambition took hold of me, and I wanted to describe all Maigrets, then later all Simenon’s novels.
A: What is Maigret.de nowadays?
OH: Anyone in the German-speaking world who wants to learn about Simenon and Maigret — be it in terms of content or bibliography — will probably end up on this website sooner or later. It offers current information on publications of books and films, and there is an archive of old articles on the writer.
At the same time, some contributions make references between fiction and reality, such as historical events, people, and places. Much of what was common knowledge at the time of writing seems foreign today. At this point, the site plays the role of an explainer.
A: Is it exactly what and how you wanted?
OH: No, actually, I just wanted to learn HTML. And later CSS. Then I added knowledge of script languages, database skills, CMS, animation, JavaScript… and a whole series of books on web technologies, and much more by and about Simenon. Looking back, I would be lying if I said that such a “maigret.de” was my goal.
I also believe that it is not normal: most sites of this kind have disappeared over the years. Or they became more professional and commercial.
A: What’s next in your plans on Maigret.de? Do you have a roadmap?
OH: After all the novels are described, you ask yourself, what do you do next? I decided to read the stories again: In doing so, I collect facts and figures. Maigret lovers are as crazy as lovers of other things: for example, they like to search for clues. So I provide maps to ease classification or even a walk. And there are the questions: “Who…” and “How often…” And I collect this data and thus have another leisure activity for years.
A: Sounds exciting! Okay, so now let’s speak about data visualization. Why do you need charts at all?
OH: Actually, I come from the design side. Design always played a significant role in the website. The many texts I have written have always included pictures, and where possible, I have tried to use charts. Of course, you can also present data in tables, but if you visualize it with a graphic, it is often easier for a reader to grasp and nicer to look at.
A: What kind of data do you visualize and in what charts?
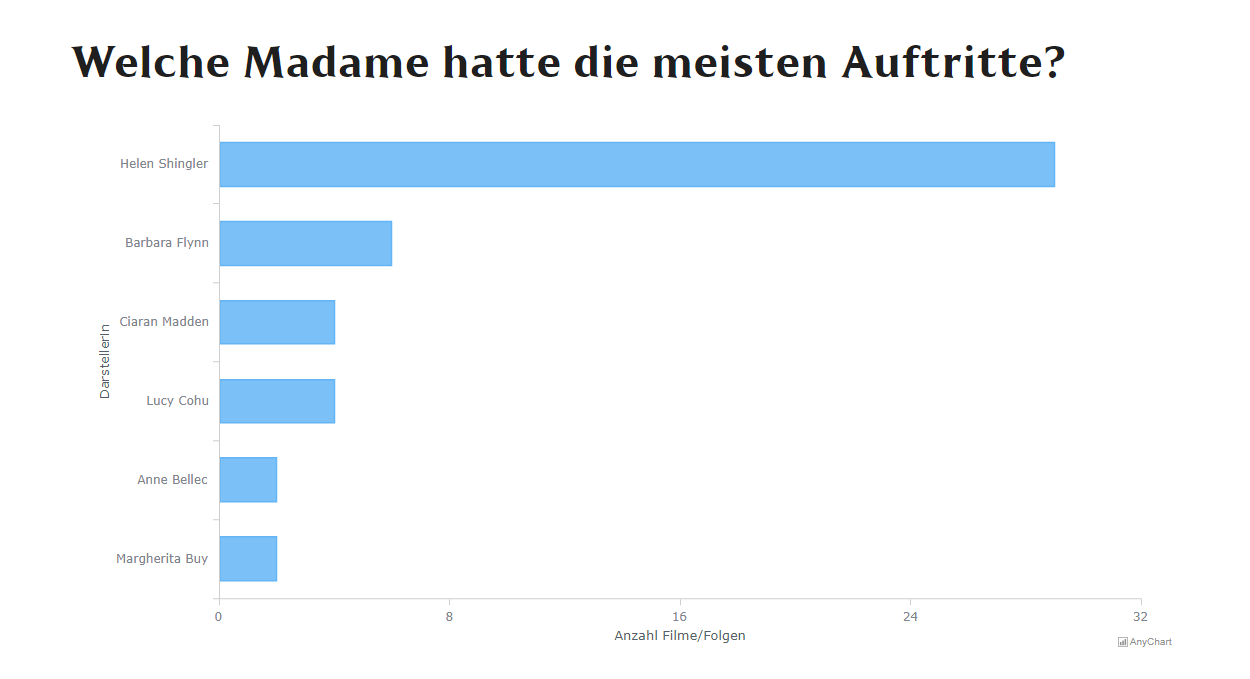
OH: People love rankings. Which novel was published how often? Which actor has played Maigret how many times? Which publisher published the most Simenon books? And while I’m dealing with a topic, sometimes a “stupid” question also comes to mind.
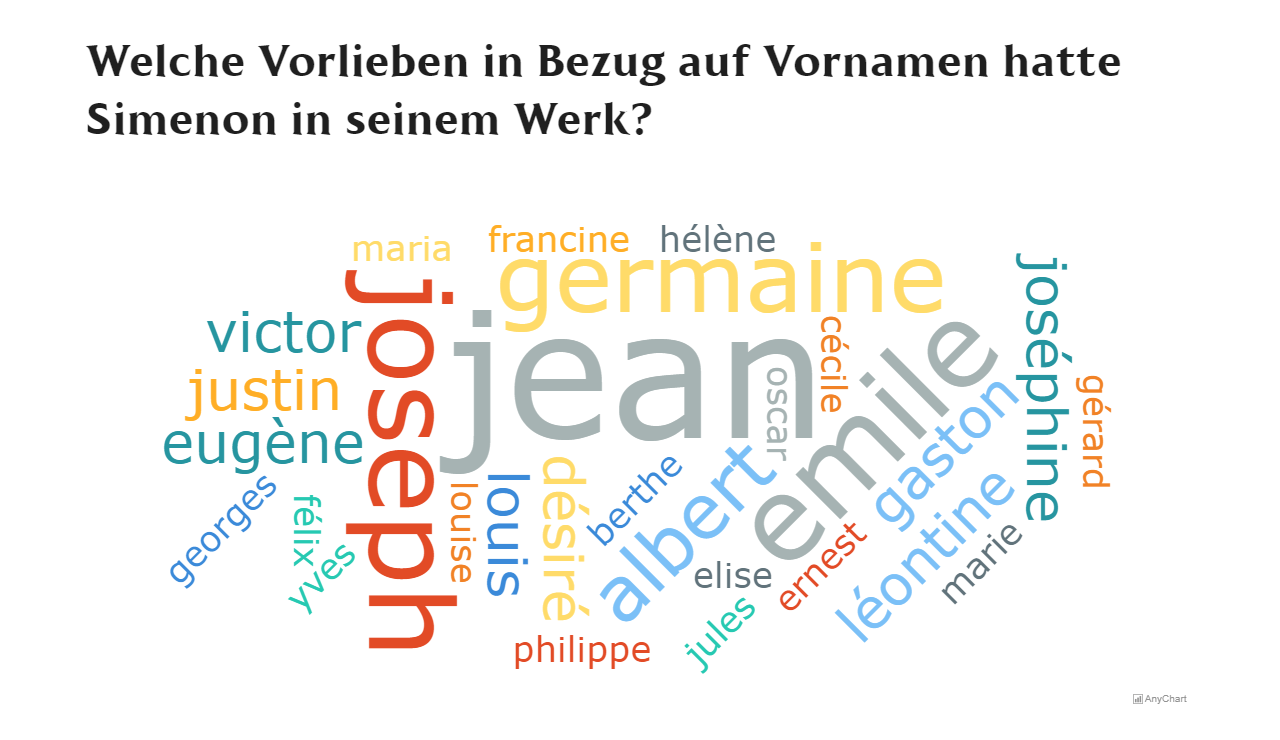
Not long ago, I wondered if Simenon had preferred specific names in his work. I had the impression that this had been the case. A word cloud seemed to be a suitable way of visualizing this. Especially because it’s nice to look at.
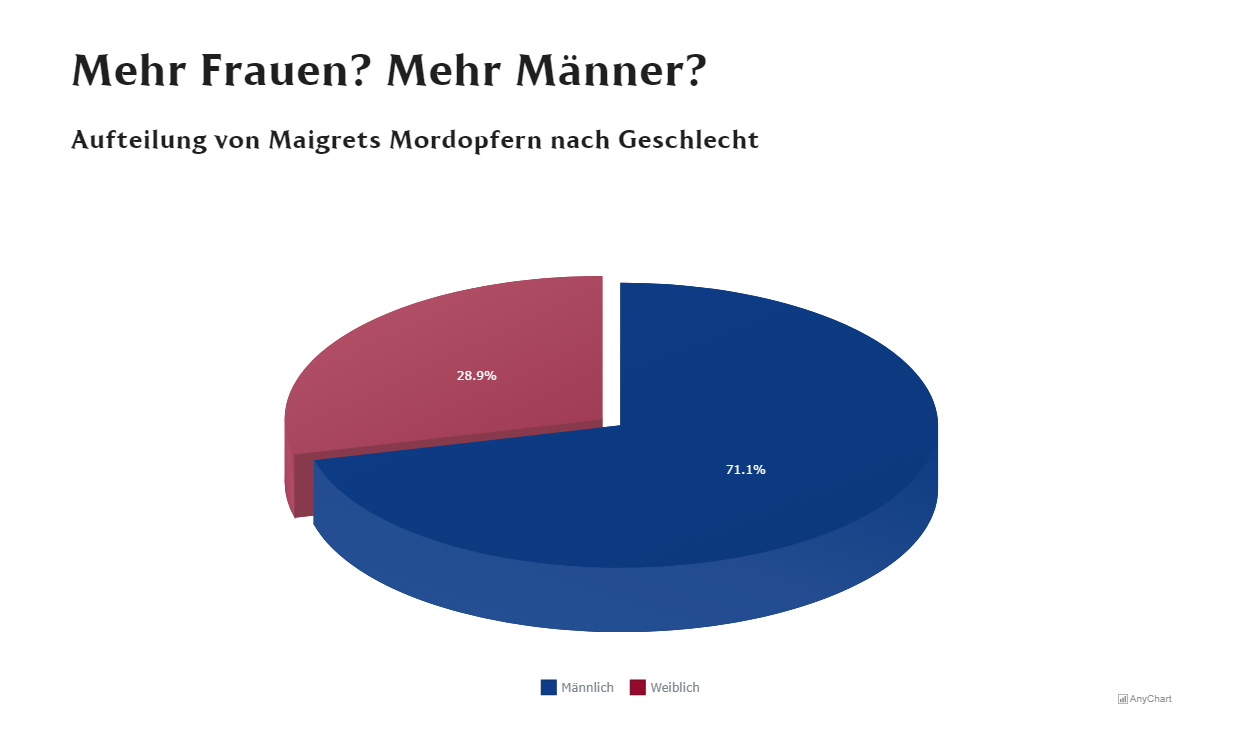
But to be honest, most of my charts are pie charts and bar charts. They visualize data on German-language book editions and films as well as the number of Maigret cases in the arrondissements of Paris, the gender of the murder victims, and the type of crime.
A: Please tell us more about the technical side of maigret.de and your technology stack.
OH: The times of static HTML pages are long gone, and after having my own small CMS in the beginning, I later switched to pMachine and its successor ExpressionEngine. The bibliographic data and information on films, radio plays, and actors are stored in MySQL tables. I can partly query this via ExpressionEngine’s template language, but if the queries are more complex and nested, I can include PHP in the template.
The project runs in my spare time, and I am not a programmer. My main goal is to provide substantial and well-designed content. Technology is a means to the aim.
A: Why did you pick AnyChart for interactive data visualization in your project?
OH: When I had the idea to visualize the characters’ first names, I looked for different solutions. My requirement was that it looked good, easy to integrate, and be robust enough to withstand my amateurish nature. I tried various solutions, and only AnyChart worked right away. I don’t think that necessarily speaks against other solutions. But, and this is important to me, I have found an easy-to-integrate and stable software that supports me and doesn’t cause more trouble.
A: What did you like most about using our JavaScript charting library?
OH: Found it, tried it, it works. I can take care of the content and don’t have to worry about the technology behind it.
A: There is always room for improvement. What do you think we should add or change to AnyChart moving forward.
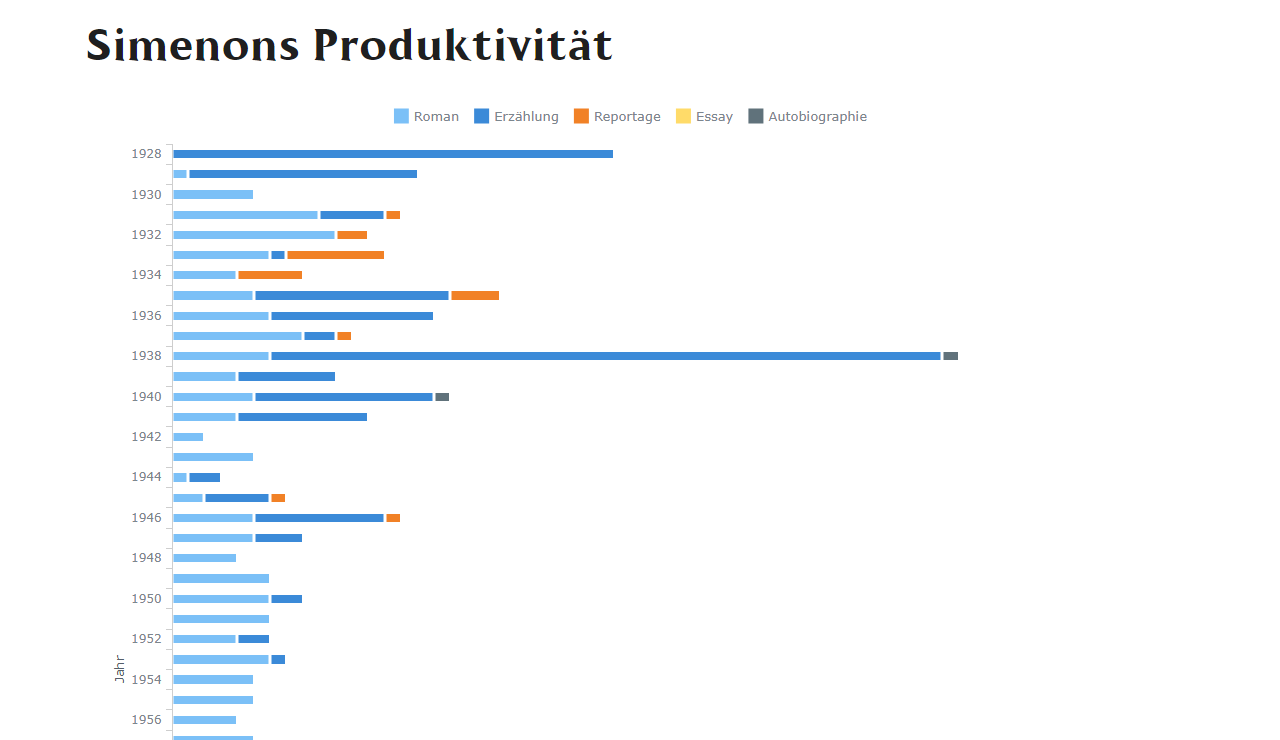
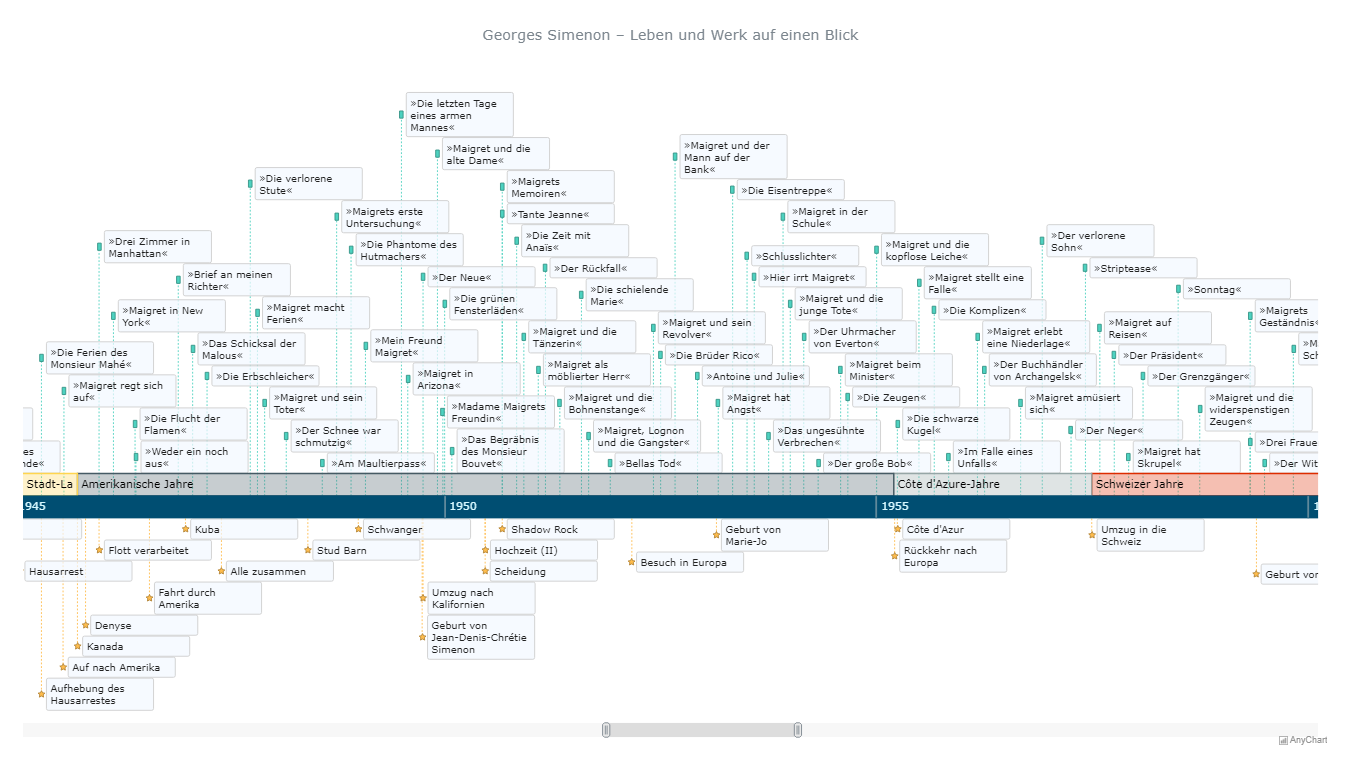
OH: If you had asked me in the spring, I would have said I’d like a timeline chart. Then I saw in the summer that the function had long been available. I was thrilled by the timeline of horror movies in your gallery of JavaScript chart examples. That’s exactly how I wanted it for the biographical and bibliographical data on maigret.de! So I can honestly say that I don’t miss anything anymore.
A: The next time someone asks you to recommend a JavaScript charting library, will it be AnyChart?
OH: Well, unfortunately, it is the case that I am asked more about Simenon and Maigret. But if you should get my opinion on chart software and visualization, I will definitely recommend AnyChart. My reasons may be banal: It’s as easy to integrate and use as I want it to be.
A: Thank you so much, Oliver! Take care and all the best!
If you would like to share your AnyChart story, please feel free to drop us a line!
Don’t miss out on looking at more customer stories on our blog and selected case studies.
- Categories: AnyChart Charting Component, Books, HTML5, JavaScript, Success Stories
- No Comments »