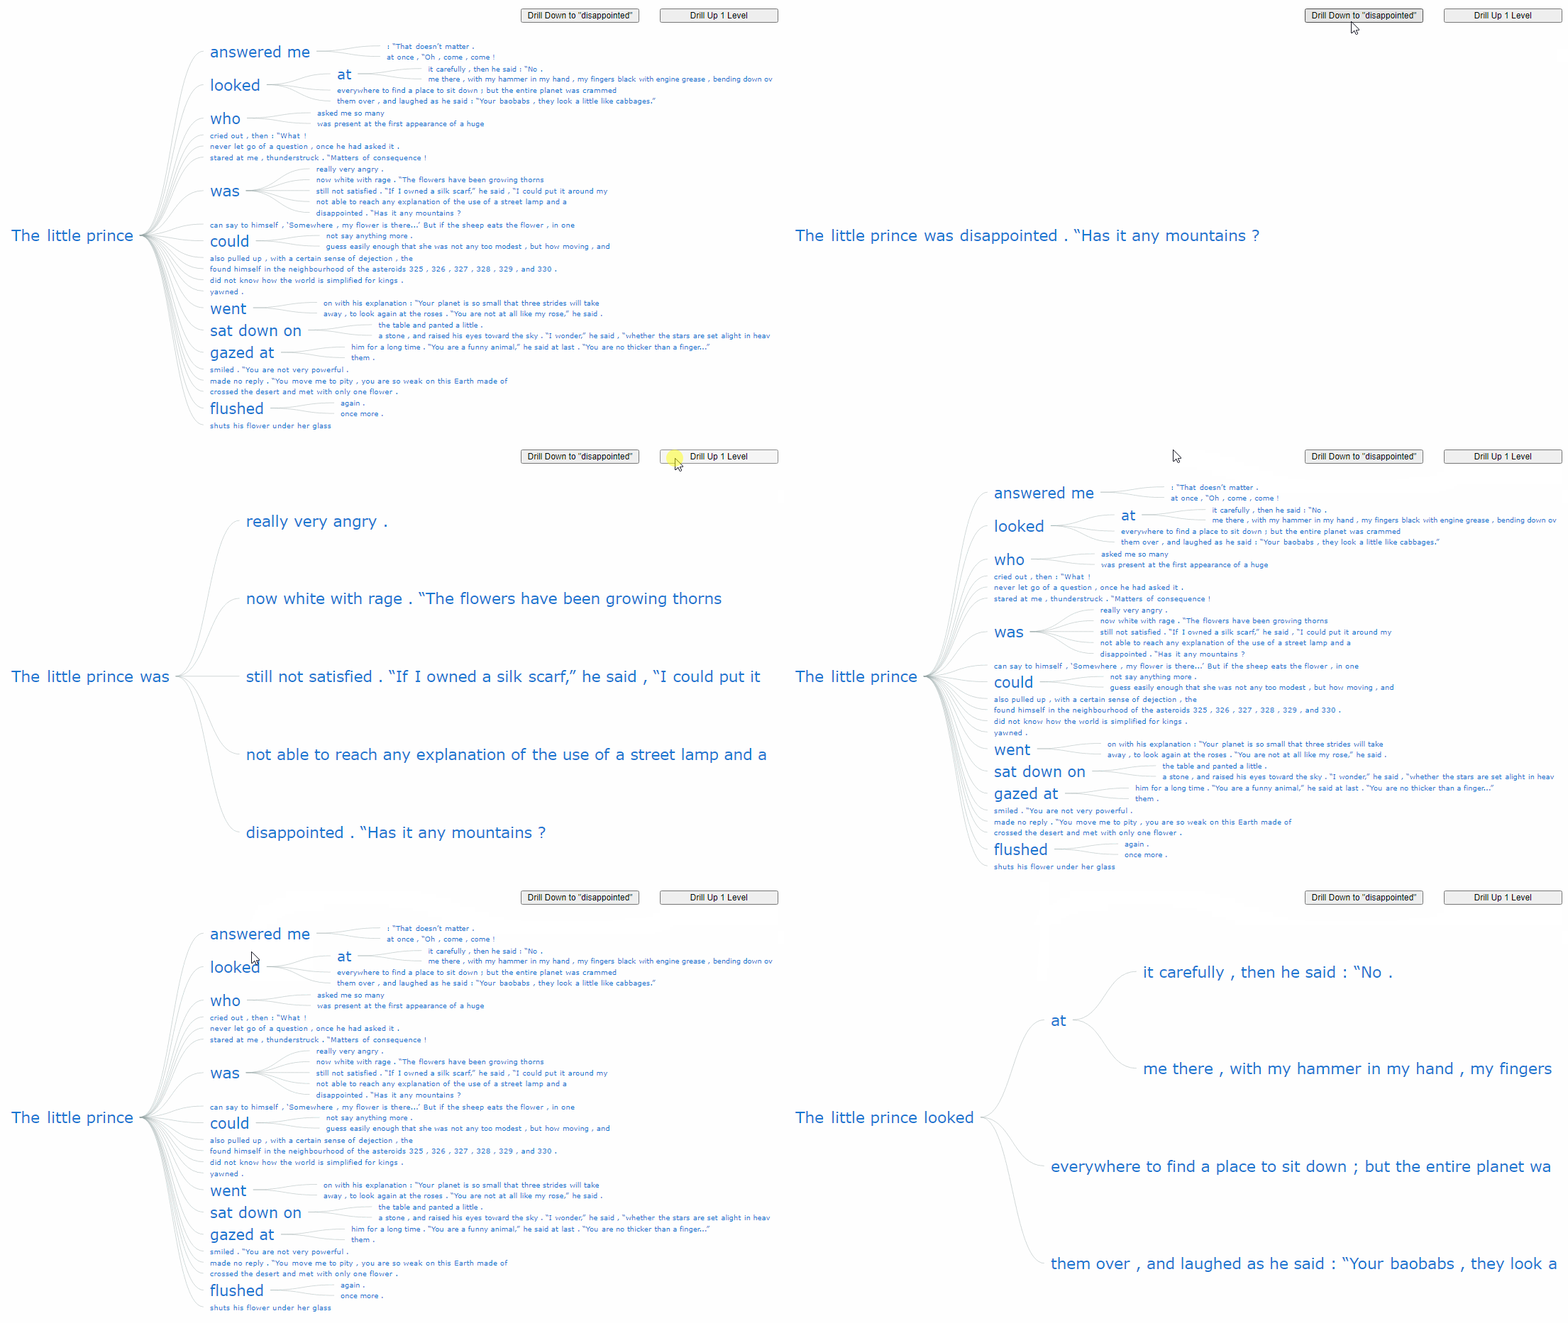
 Data visualization is not only useful for communicating insights but also helpful for data exploration. There are a whole lot of different chart types that are widely used for identifying patterns in data. One of the lesser-used chart types is Word Tree. It is a very interesting visualization form, quite effective in analyzing texts. And right now, I will teach you how to quickly create nice interactive word tree charts using JavaScript.
Word trees display how a set of selected words are connected to other words in text data with a branching layout. These charts are similar to word clouds where words that occur more frequently are shown bigger. But they are different in the sense that word trees also show the connection between the words, which adds context and helps find patterns.
In this tutorial, I will create a lovely word tree from the text of the very famous book The Little Prince by French aviator and writer Antoine de Saint-Exupéry. Check out a demonstration of the final chart below and keep reading to learn how this and any other interactive JS word tree can be built with ease.

Making a Basic JavaScript Word Tree
An interactive JS word tree chart can look complicated. But follow along to learn how to build it in just four really simple steps.
- Create an HTML page.
- Include the required JavaScript files.
- Prepare the data.
- Add some JS code for the chart.
1. Create an HTML Page
The initial step is to create an HTML page that will hold the chart. In the page, add a <div> element with an id that will be referenced later.
<html>
  <head>
    <title>JavaScript Word Tree Chart</title>
    <style type="text/css">
      html, body, #container {
        width: 100%; height: 100%; margin: 0; padding: 0;
      }
    </style>
  </head>
  <body>
    <div id="container"></div>
  </body>
</html>
To make the word tree occupy the whole page, specify the width and height parameters as 100%. This can be adjusted as per the requirements of your project.
2. Include the Required JavaScript Files
It is convenient to use a JavaScript charting library to create the word trees. The best part of using such libraries is that out-of-the-box charts can be quickly made without advanced technical skills. In this tutorial, I am working with AnyChart based on its word tree documentation. It is free for non-commercial use, but anyway, it is only an example. The logic of data visualization remains quite similar for all JS charting libraries. So, basically, you can use this learning to create charts with others that have pre-built word trees, too.
I will include the required JS files from the CDN of AnyChart in the <head> section of the HTML page. For the word tree chart, I need to add two scripts: the core module and the word tree module.
<html>
  <head>
    <title>JavaScript Word Tree Chart</title>
    <script src="https://cdn.anychart.com/releases/8.10.0/js/anychart-core.min.js"></script>
    <script src="https://cdn.anychart.com/releases/8.10.0/js/anychart-wordtree.min.js"></script>
    <style type="text/css">
      html, body, #container {
        width: 100%; height: 100%; margin: 0; padding: 0;
      }
    </style>
  </head>
  <body>
    <div id="container"></div>
    <script>
      // All the code for the JS word tree chart will come here
    </script>
  </body>
</html>
3. Prepare the Data
I downloaded the text of the famous book The Little Prince by Antoine de Saint-Exupéry from an online library and created the data file that you can download here.
To access the data file, I need jQuery and therefore include its script in the code.
<script src="https://code.jquery.com/jquery-latest.min.js"></script>Now that all the preliminary steps are done, let’s get to the main part. You are going to love how quickly a functional interactive word tree chart can be made with so few lines of JavaScript code.
4. Add Some JS Code for the Chart
Before writing any code, the first thing I do is add an enclosing function that executes the code inside it only after the page is ready and then loads the data file using Ajax.
anychart.onDocumentReady(function () {
  $.ajax(
"https://gist.githubusercontent.com/shacheeswadia/ccbccc482b1fb691405e07772c0fbfa0/raw/fb7b5972838b4212f4551c4cc9d5fc026fc2e8c3/littleprince.txt"
  ).done(function (text) {
  });
});
Next, I create the chart using the wordtree() function of the JS library.
var chart = anychart.wordtree(text);In a word tree, an important part is defining the root words which branch out to various sentences in the text. Here, I define ‘The’ as the start of the root and drill down to ‘prince’ as the end of the root so the combined root words become ‘the little prince’.
// set the root word
chart.word("The");

// drill down to the next word in the tree
chart.drillTo("prince");
Finally, I just need to set the container and draw the chart.
// set container id for the chart
chart.container("container");

// initiate chart drawing
chart.draw();
Voila, that’s all I do to bring the interactive word tree to life on the web page!
You can check out this initial version of the JS word tree chart with the code below or on CodePen [or on AnyChart Playground].
<html>
  <head>
    <title>JavaScript Word Tree Chart</title>
    <script src="https://cdn.anychart.com/releases/8.10.0/js/anychart-core.min.js"></script>
    <script src="https://cdn.anychart.com/releases/8.10.0/js/anychart-wordtree.min.js"></script>
    <script src="https://code.jquery.com/jquery-latest.min.js"></script>
    <style type="text/css">
      html, body, #container {
        width: 100%; height: 100%; margin: 0; padding: 0;
      }
    </style>
  </head>
  <body>
    <div id="container"></div>
    <script>
      anychart.onDocumentReady(function () {
        $.ajax(
"https://gist.githubusercontent.com/shacheeswadia/ccbccc482b1fb691405e07772c0fbfa0/raw/fb7b5972838b4212f4551c4cc9d5fc026fc2e8c3/littleprince.txt"
        ).done(function (text) {

          // create word-tree chart
          var chart = anychart.wordtree(text);

          // set the root word
          chart.word("The");

          // drill down to the next word in the tree
          chart.drillTo("prince");

          // set container id for the chart
          chart.container("container");

          // initiate chart drawing
          chart.draw();

        });
      });
    </script>
  </body>
</html>
This looks great but there is so much more that can be done to make the word tree look more polished and I will show you how to do that.
Customizing a JS Word Tree Chart
JS charting libraries are great to have a basic visual ready very fast and then a plethora of options to customize the chart. Let me show you how to make this word tree more beautiful and personalized.
1. Formatting the Connectors
The branches of our word tree look a bit squished so let’s modify them to make the tree appear more spaced out. There is an option to make straight line connectors which I will try and also change the stroke settings.
// configure the connectors
var connectors = chart.connectors();
connectors.length(100);
connectors.offset(10);
connectors.curveFactor(0);
connectors.stroke("0.5 #96a6a6");
It’s all quite straightforward and here is how our word tree looks with just these changes.
The interactive version is available on CodePen [and AnyChart Playground] where you can also find its full code.
To be honest, I like the curved connectors more, so going forward I restore them.
2. Configuring the Font Size and Color
I simply modify the font size and color to make the chart more individualized. Again, it’s quite simple and requires only a few lines of code.
// configure the font
chart.fontColor("#1976d2");

// set chart's font size minimum and maximum
chart.minFontSize(8);
chart.maxFontSize(24);
3. Adding Custom Drill-Down and Drill-Up Buttons
Did you notice how awesome the default drilling up and down is in the word tree? Just by clicking on a word, the chart automatically scales to that level.
The inbuilt functionality is super but in case required, I will show you here how you can add a button to drill down to a specific word and also a button to drill up one level at a time.
I create a container in HTML and add two buttons in it — one for drill down to my chosen word ‘disappointed’ and one for drill-up. You can of course choose any word that exists in the tree.
<div id="buttons">
  <button onclick="drillToItem()">Drill Down to "disappointed"</button>
  <button onclick="drillUpALevel()">Drill Up 1 Level</button>
</div>
I also add the styling for the buttons.
<style type="text/css">
  html,
  body,
  #container {
    width: 100%;
    height: 100%;
    margin: 0;
    padding: 0;
  }

  #buttons {
    display: flex;
    flex-direction: row;
    justify-content: flex-end;
  }

  button {
    width: 15vw;
    margin: 1rem;
  }
</style>
Next, I add two functions, one that handles the drill down to the specified word and the other that drills up one level of the tree.
// drill down to a data item
function drillToItem() {
  // locate an item in the data tree and get it as an object
  var item = chart.data().search("value", "disappointed");
  // drill down to the item
  chart.drillTo(item);
}

// drill up a level
function drillUpALevel() {
  chart.drillUp();
}
Have a look at the entire code of this awesome final JavaScript word tree chart here or on CodePen [or on AnyChart Playground].
<html>
  <head>
    <title>JavaScript Word Tree Chart</title>
    <script src="https://cdn.anychart.com/releases/8.10.0/js/anychart-core.min.js"></script>
    <script src="https://cdn.anychart.com/releases/8.10.0/js/anychart-wordtree.min.js"></script>
    <script src="https://code.jquery.com/jquery-latest.min.js"></script>
    <style type="text/css">
      html, body, #container {
        width: 100%; height: 100%; margin: 0; padding: 0;
      }
      #buttons{
        display: flex;
        flex-direction: row;
        justify-content: flex-end;
      }
      button {
        width: 15vw;
        margin: 1rem;
      }
    </style>
  </head>
  <body>
    <div id="buttons">
      <button onclick="drillToItem()">Drill Down to "disappointed"</button>
      <button onclick="drillUpALevel()">Drill Up 1 Level</button>
    </div>
    <div id="container"></div>
    <script>
      anychart.onDocumentReady(function () {
        $.ajax(
"https://gist.githubusercontent.com/shacheeswadia/ccbccc482b1fb691405e07772c0fbfa0/raw/fb7b5972838b4212f4551c4cc9d5fc026fc2e8c3/littleprince.txt"
        ).done(function (text) {

          // create word-tree chart
          var chart = anychart.wordtree(text);

          // set the root word
          chart.word("The");

          // drill down to the next word in the tree
          chart.drillTo("prince");

          // configure the connectors
          var connectors = chart.connectors();
          connectors.length(100);
          connectors.offset(10);
          connectors.stroke("0.5 #96a6a6");

          // configure the font
          chart.fontColor("#1976d2");

          // set chart's font size minimum and maximum
          chart.minFontSize(8);
          chart.maxFontSize(24);

          // set container id for the chart
          chart.container("container");

          // initiate chart drawing
          chart.draw();

        });
      });

      var chart;

      // drill down to a data item
      function drillToItem() {
        // locate an item in the data tree and get it as an object
        var item = chart.data().search("value", "disappointed");
        // drill down to the item
        chart.drillTo(item);
      }

      // drill up a level
      function drillUpALevel() {
        chart.drillUp();
      }

    </script>
  </body>
</html>
Conclusion
So then, let’s be honest. Wasn’t this really easy and so cool to build?
If you want to keep learning and playing with this visualization, see the word tree documentation and get some inspiration from these examples. Or pick another JS charting library and try to go with it based on the same technique.
The Little Prince gives us profound wisdom. And JavaScript is great for creating interactive charts. So, let’s use both and make some stunning visualizations!
Published with the permission of Shachee Swadia. Originally appeared on Hacker Noon under the title “Creating an Interactive Word Tree Chart with JavaScript” on September 2, 2021.
Find out more about word tree charts on Chartopedia and see other JavaScript charting tutorials on our blog.
Got an awesome guest post idea? Get in touch!
- Categories: AnyChart Charting Component, Big Data, Books, HTML5, JavaScript, JavaScript Chart Tutorials, Tips and Tricks
- No Comments »