 Sunburst charts are known to be greatly useful for visualizing hierarchical data structures. So it is no surprise that this chart type became a big hit among our users immediately after we added it to the AnyChart JavaScript library. Because the core of our global customer base is enterprise clients, most of the real-world use cases for our JS sunburst chart are hidden in internal corporate apps. But AnyChart is often picked for data visualization in open projects as well, and we invite you to see a super cool example we have recently found out about — Redis Inventory. It is an open-source tool that makes it easy to view Redis memory usage by key patterns in a hierarchical way, with an interactive sunburst chart in action.
Learn more about Redis Inventory and how AnyChart is used there from our quick interview with its creator Aleksandr Obukhov. (Stack: Go/Cobra/Redis.)
AnyChart: Hey Aleksandr! Let’s begin with a quick introduction. Could you please tell our community about yourself and what you do?
Aleksandr Obukhov: My name is Aleksandr Obukhov and I am a software engineer. Currently, I am located in Berlin, Germany, working at the company called AMBOSS, a leader in online education for medical students and practicing doctors in Germany.
Originally I am from Russia. Born in a nearby town, I studied computer science in Moscow and then lived and worked there for the first ten years of my career.
I have worked mostly in the backend field in online education web services. My current position is engineering manager but I try to keep myself involved in technologies as much as possible.
A: How did you come up with the idea of Redis Inventory?
AO: We use Redis extensively in our tech stack, and once we faced the issue that the amount of data stored in Redis had increased and it was very hard to trace back what was the reason. That’s how the idea of the tool appeared.
I already had experience solving Redis-related issues with Golang efficiently by writing an open-source tool called go-redis-migrate. I wanted to create this new Redis Inventory tool as another open-source project for others’ benefit. I see other potential users having the same problem, investigating the health of data caching policies. This problem, I believe, is quite common for web applications.
A: What is the tool’s current functionality and how are you planning to develop it further?
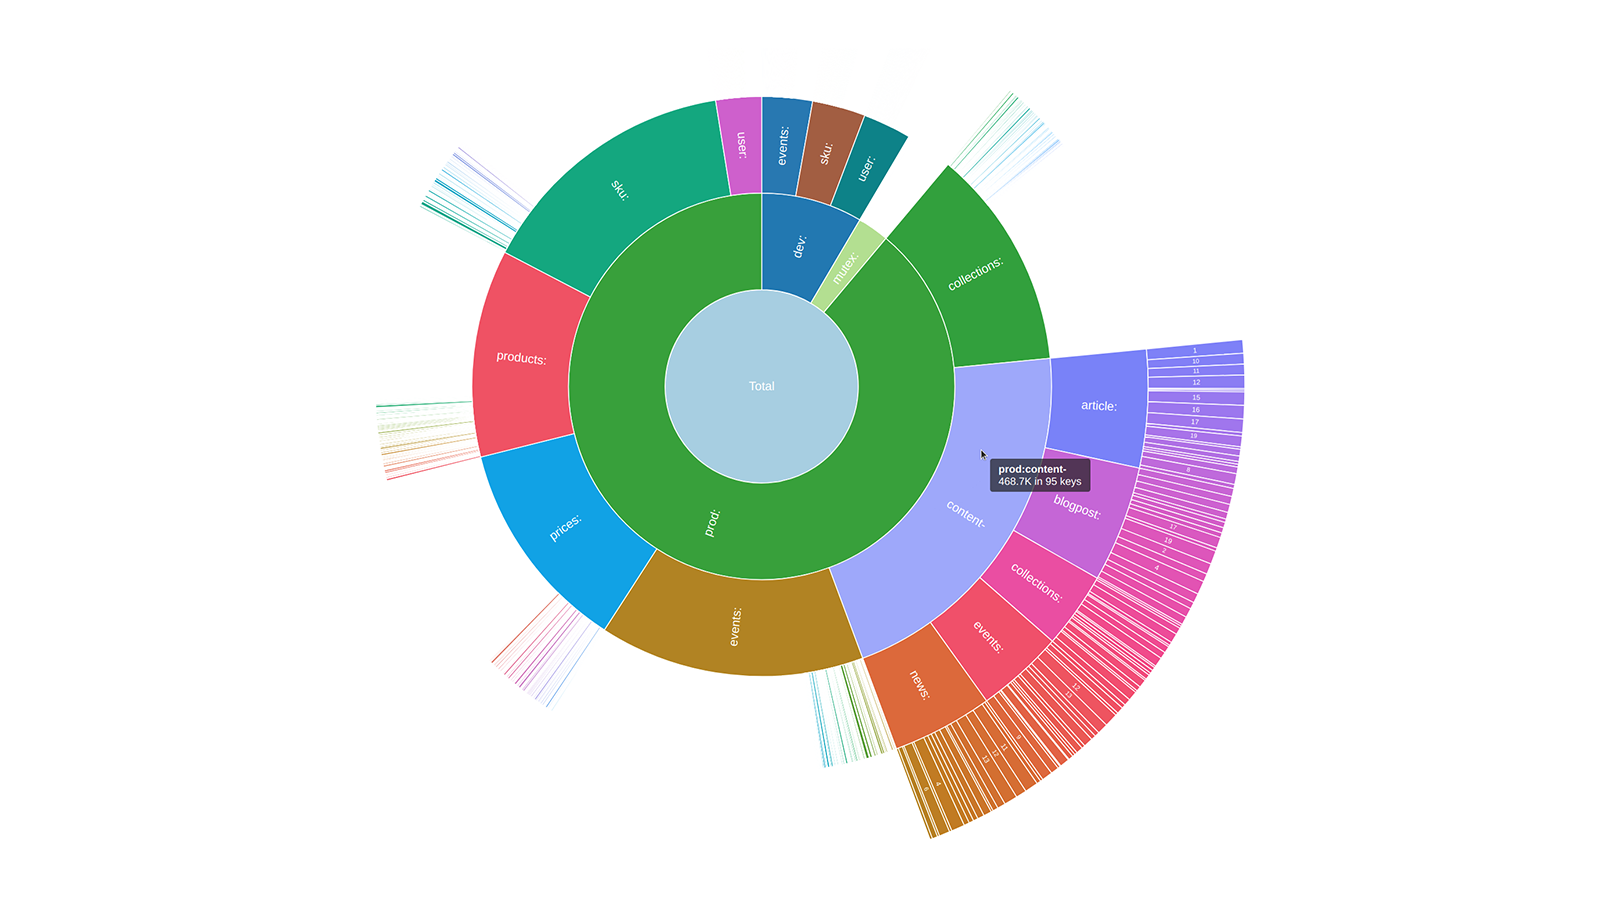
AO: The tool indexes Redis DB, recording the sizes of the values and the corresponding keys. It tries to recognize key patterns and builds a structure called “prefix tree” to represent the data hierarchically. For more details you can refer to my blog post on Medium — I tried to cover all the details there.
I’ve already tested it on some datasets and it works exactly as I imagined. Further usage, of course, can indicate a need for some improvements.
I had some ideas I haven’t yet implemented, like collecting data about TTLs. I may work on them eventually, but they were not part of the “core” functionality. I’m also open to contributions if someone is missing some functionality, of course.
A: What role does data visualization play in Redis Inventory?
AO: The tool supports two main presentation formats: textual, which is convenient as you can see it right in the terminal, and graphical (a sunburst diagram implemented with AnyChart). Visualization, I believe, makes it easier to navigate the data as, unlike with textual output, you can see the proportions of certain key prefixes right away. Drill-down functionality helps to get details, “zoom in” if it is necessary.
A: Why did you decide to show data in a sunburst chart, not some different type of visualization?
AO: There were two chart types I was considering: sunburst and treemap. Both are nice and serve well for the purpose. The first type is used in Ubuntu Disk Analyzer and the latter in Disk Inventory X. I used those two pieces of software as a reference for my project. I ended up implementing only a sunburst chart so far because it works better for partial data. But maybe I’ll add a treemap chart down the road.
A: Could you please share some more details on the technical aspect of Redis Inventory? What is your stack? Was it simple enough to run AnyChart with that choice of technologies?
AO: The tech stack for the software is Go. It is simple, powerful, and can be cross-compiled for different platforms. I’ve used the Cobra framework for building a CLI interface, Radix as the Redis client, and go-pretty to format text output. I’ve written my own trie data structure implementation; I found a library but it didn’t fit because of a specific aggregation logic. The data structure is either maintained in memory or saved to / loaded from a temporary file. AnyChart integration was quite smooth — initial integration took less than an hour.
A: Why did you choose AnyChart for data visualization in your project? What did you like the most?
AO: To be honest, frontend tech is not my strongest trait. So for me, the main reason was the balance of simple integration and customization capabilities. As I said, I was able to wire it in less than an hour by writing almost no procedural code (only initialization which is mostly declarative). Then I used handy callbacks to customize labels, tooltips, and colors.
A: From your point of view, what should be improved in our JavaScript charting library?
AO: I cannot suggest any particular code improvement. But from a “user” perspective I think the library can improve visual themes, not only including color palettes but also logic for assigning colors to the specific charts. I had to come up with my own coloring logic for nested sectors because the standard solution didn’t have enough colors. But again, thanks to callbacks it was easy to integrate although not so easy to figure out the actual logic there.
A: Would you recommend AnyChart?
AO: Sure, AnyChart has a lot of built-in features and is simple to work with and integrate. For projects similar to mine, open-source or educational, it is an absolutely great choice. Commercial products have to consider license costs, of course, and I believe AnyChart can be a good fit for ones that require a large variety of charts which are consistent in their implementation. Using such a well-established library in this case will most likely be cheaper than in-house development and maintenance.
A: Thanks for taking the time to chat, Aleksandr! All the best!
Want to share your AnyChart story? Contact us.
Look at more customer stories and selected case studies.
- Categories: AnyChart Charting Component, Big Data, HTML5, JavaScript, Success Stories
- No Comments »