 Many thousands of developers worldwide use our solutions for interactive data visualization. So it is hardly surprising to come across a graphic powered by AnyChart here or there. Some projects, however, deserve a showcase. Such a new interesting one demonstrating great use of AnyChart has recently come to our notice and we are happy to let you know about it.
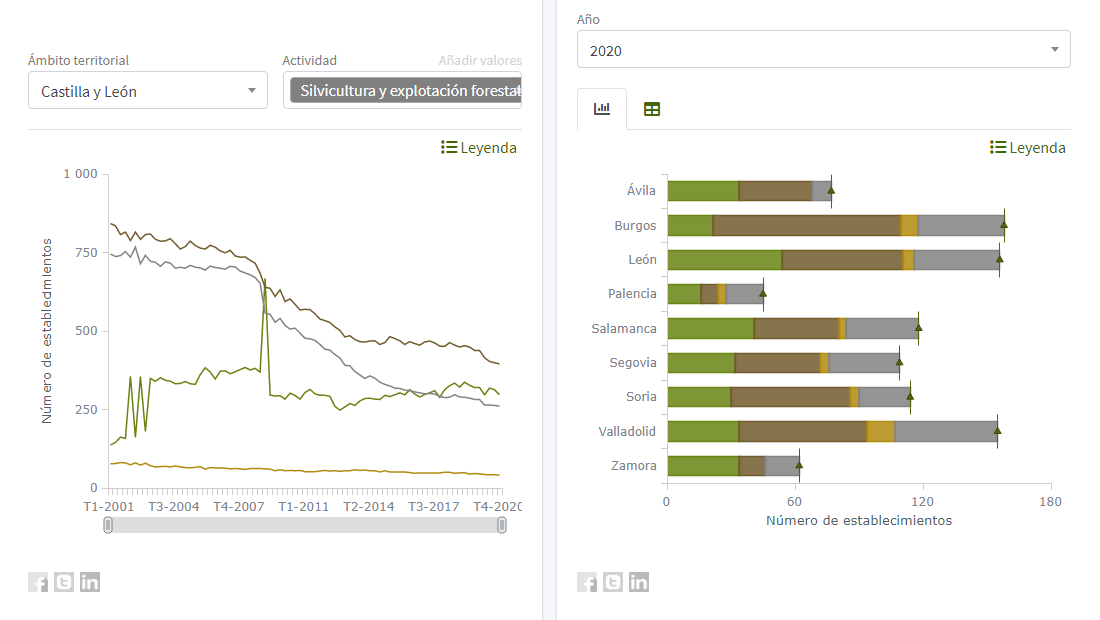
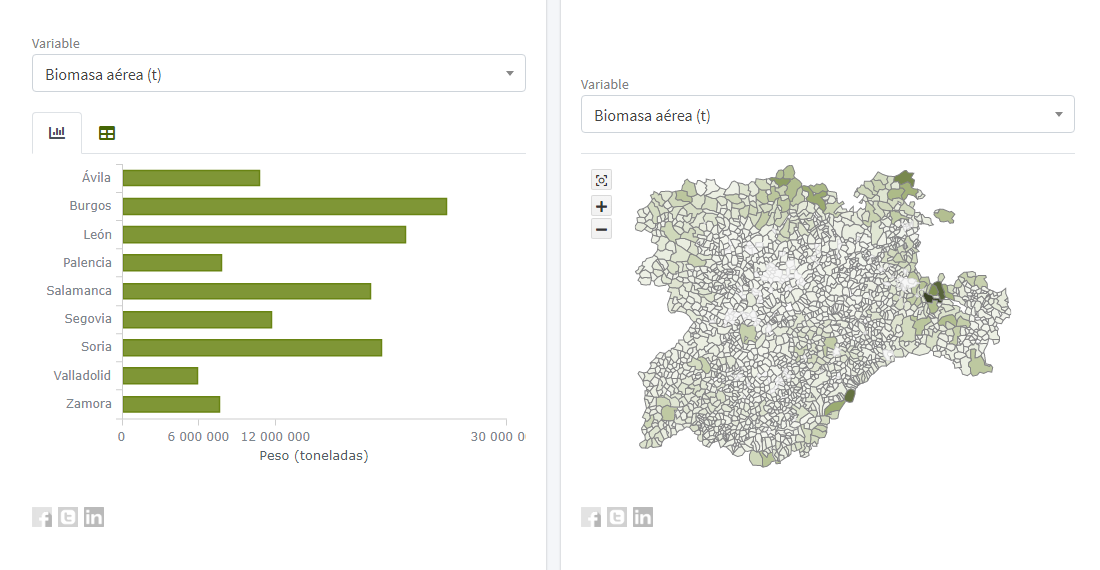
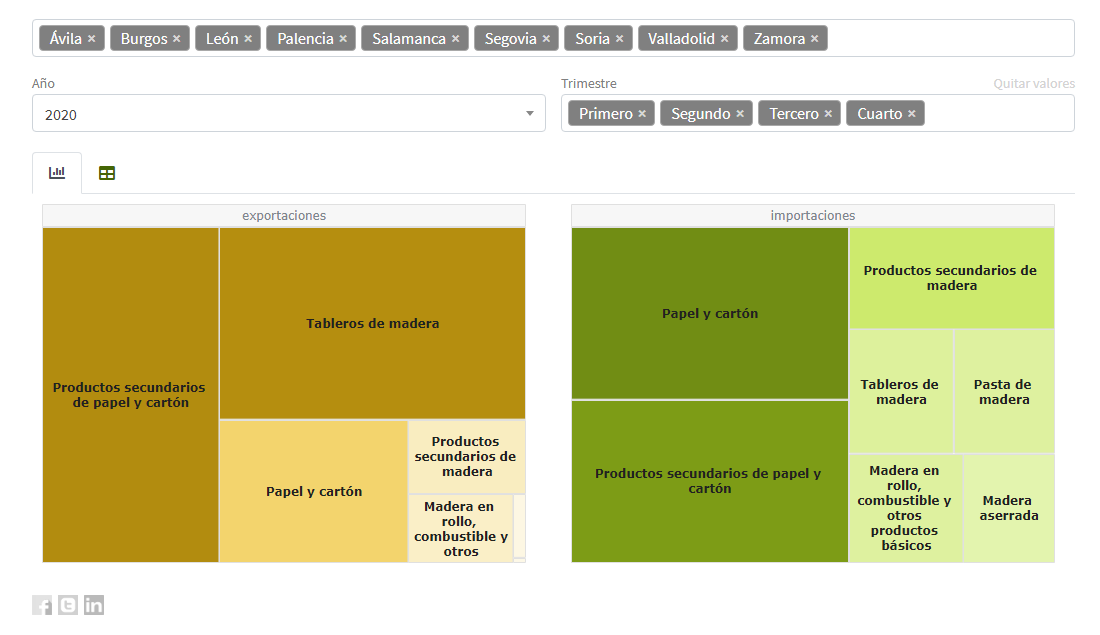
A Spanish nonprofit, Cesefor used our JavaScript charting library to visualize forestry data for the Spanish region of Castile and León in a whole lot of different charts and maps, aiming to make relevant insights easily accessible and actionable for sustainability.
The project is called Nemus. Shh, it is still in beta, not yet officially launched. But Rodrigo Gómez Conejo, Head of ICT and Knowledge Management Area at Cesefor, allowed us to let you in and even gave us a brief interview disclosing some peculiar details about the system and how AnyChart is employed — check it out below. (Stack: jQuery/CodeIgniter/PostgreSQL.)
AnyChart: Hello Rodrigo! Please briefly introduce your organization and what you do there.
Rodrigo Gómez Conejo: Hola! Cesefor is a non-profit organization founded in 2003. We work to increase competitiveness and sustainable development in the forestry sector. Personally, I am responsible for all things technology and data at Cesefor.
A: What is Nemus and why did you create it?
RGC: Nemus is a forestry information system for Castile and León, which is an autonomous community in north-western Spain. Together with the Regional Government of Castile and León (Junta de Castilla y León), which is currently our main ally providing tremendous support for the work we carry out, we decided to create it to better homogenize, organize, and distribute various data on the forestry resources, industry, and market, making it easier and more convenient to discover, monitor, and analyze.
A: Is it already a complete project?
RGC: Nemus in its current state is part of a big ongoing plan. We wanted to create multiple dashboards providing insight into the forestry value chain in our region. The timber sector is already developed and there are many tools for visual data analysis. Now we are working on integrating information on other resources, intending to release dashboards for mushrooms, resin, hunting, and fishing in the near future.
A: What role does data visualization play in Nemus? How does it help?
RGC: In the forestry sector, many natural and economic processes are not well digitized and real-time information is hard to get. Our dashboards integrate all data and present them in a single place and an intuitive visual form.
A: How do you use AnyChart there?
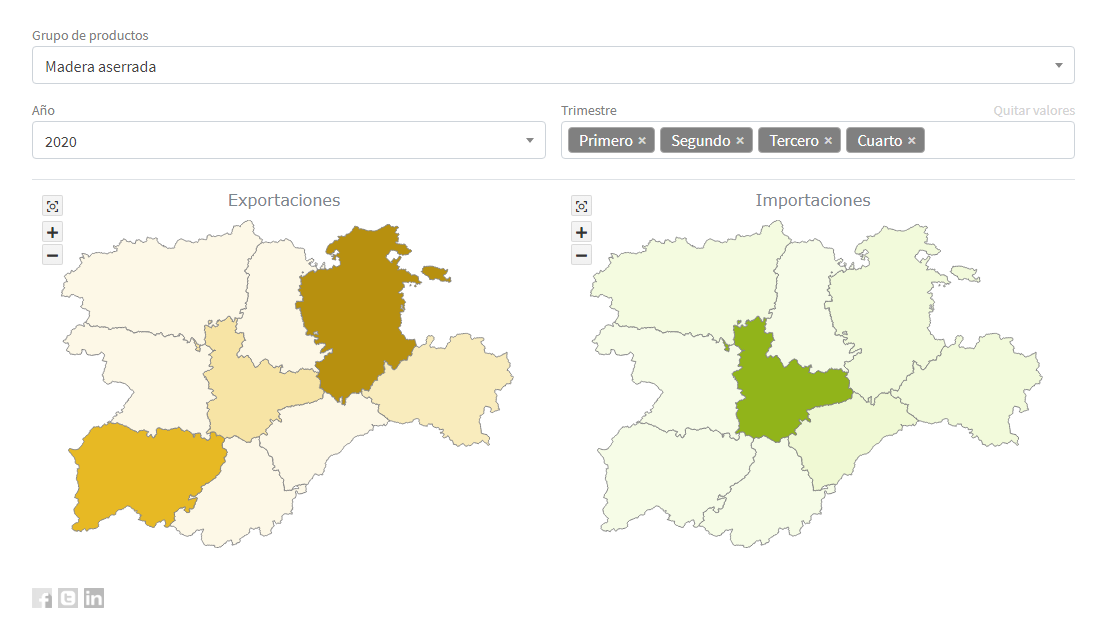
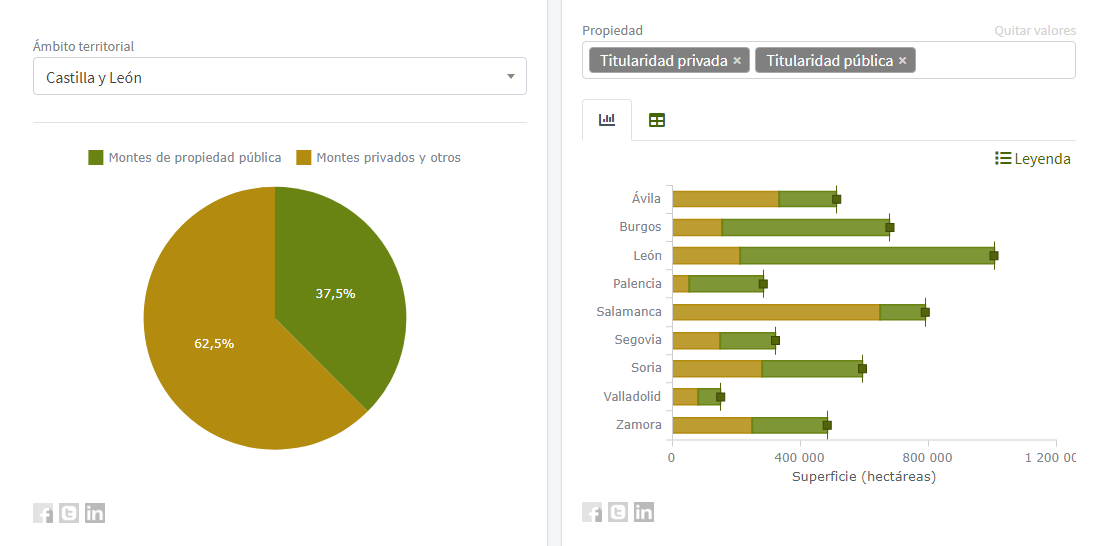
RGC: AnyChart made it easy for us to visualize forestry information in a wide range of informative data graphics. Specifically, we used it to build bar, stacked bar, treemap, box, pie, line, and Sankey charts, as well as choropleth and flow maps.
For the team responsible for creating and updating charts, we built a special chart editor which now allows them to work without a developer. The editor has around a hundred general and graph type-specific options providing full control of tooltips, colors, series manipulation, series rename, variable axes labels depending on the filters applied, and so on.
A: Please tell us some more about the technical side. What technology stack is Nemus built on? Was it easy enough to integrate AnyChart?
RGC: We use CodeIgniter for a framework, PostgreSQL for the database, and jQuery for the frontend. We did not encounter any major difficulties to integrate AnyChart into our project and all went pretty smoothly.
A: Working with AnyChart, what do you like the most about our charting library?
RGC: AnyChart is very well-documented and simple to integrate.
A: Please tell us how we can further improve AnyChart: What do you think it lacks?
RGC: I think AnyChart is indeed very complete as a data visualization solution. One function that may be missing and I would love to see in the future versions is cursor sync across multiple charts.
A: We will definitely look into this! Thank you so much and all the best!
See the Cesefor case study just added to the selected case studies.
Don’t miss out on more customer story interviews like this in our blog.
Where and how are you using AnyChart? Contact us to share your story!
- Categories: AnyChart Charting Component, AnyMap, Big Data, Dashboards, HTML5, JavaScript, Success Stories
- No Comments »