 As always, when the end of another week is so close, we’ve selected four of the new interesting data stories and are glad to share them with you. It’s Data Visualization Weekly! And here are the visualizations and the stories they illustrate, which we invite you to take a look at:
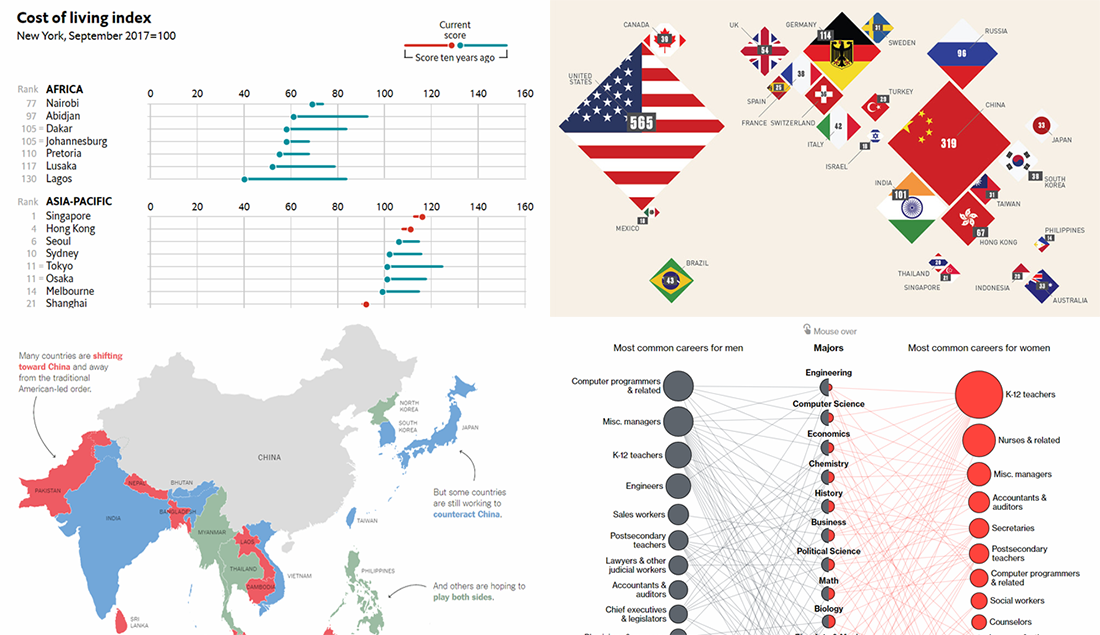
- career inequalities between men and women in the US;
- China-US rivalry for dominance in Asia;
- the most expensive cities worldwide;
- top 25 countries with the most billionaires.
Data Visualization Weekly: March 9, 2018 – March 16, 2018
Career Inequalities Between Women and Men
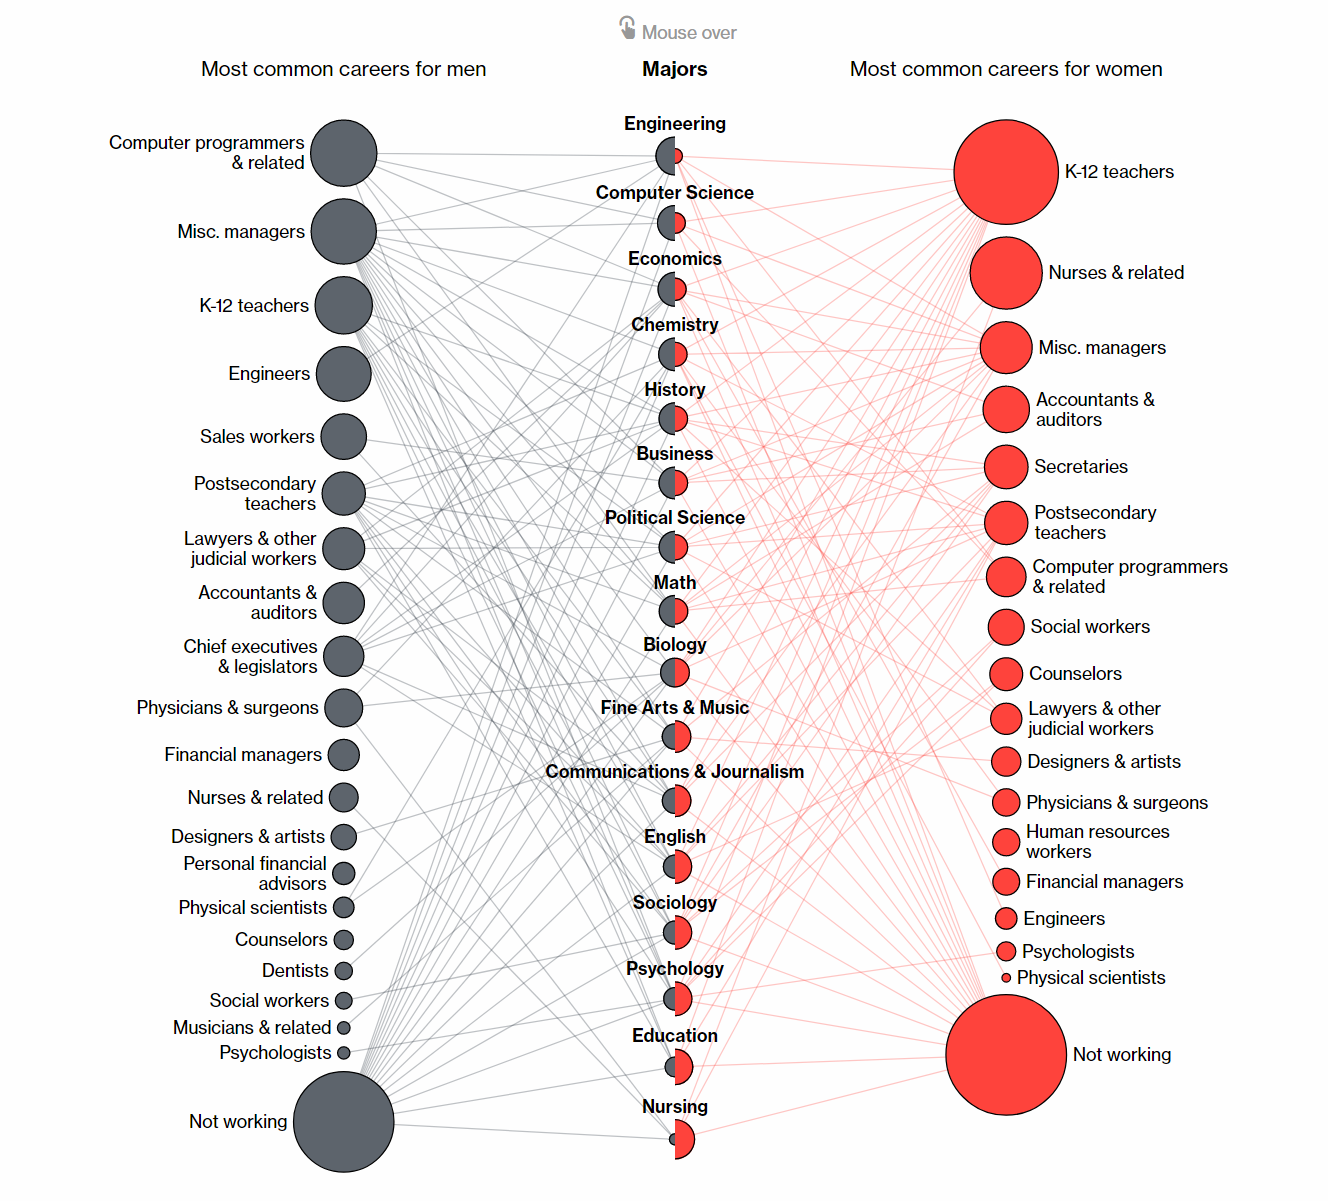
Bloomberg conducted research into the difference in the career of men and women in the US. We invite you to check out the results of their analysis of data from the American Community Survey about income, occupation and educational attainment, which are represented in the text along with a lot of insightful charts making up an example of great, interesting data stories.
China-US Rivalry for Dominance in Asia
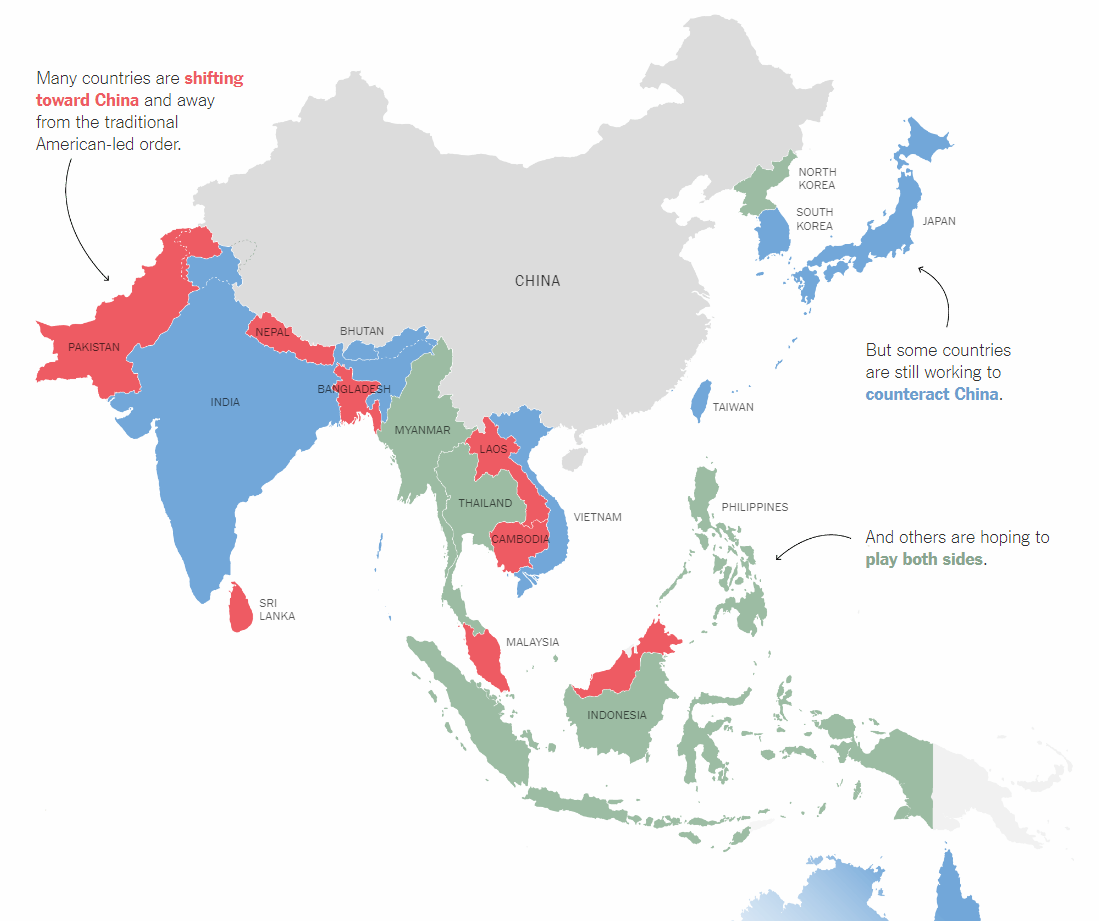
The New York Times shows what’s happening in the China-US rivalry in Asia and how China is challenging the decades-old American dominance in the region. Charts and infographics in this article display a picture of what countries shift toward China, counteract it, or balance between the two powers.
Most Expensive Cities Worldwide
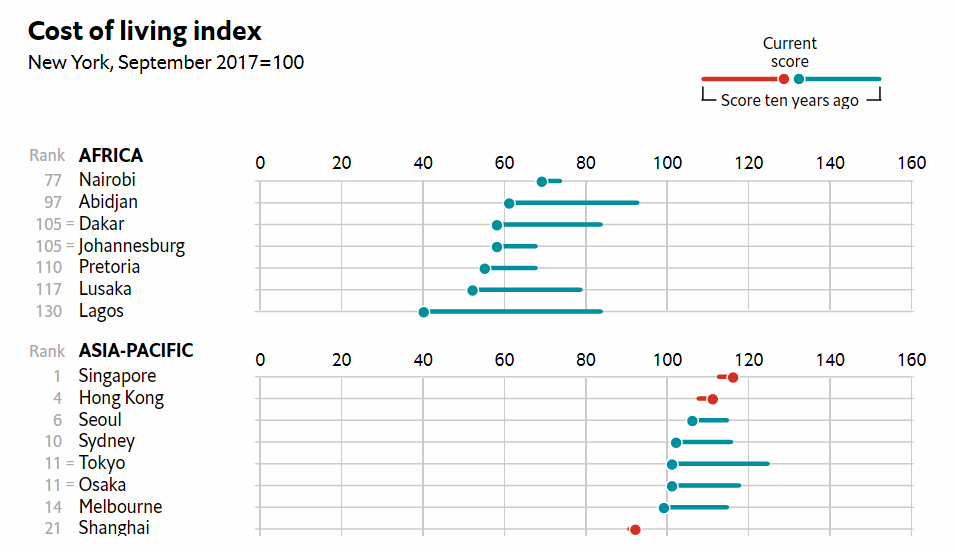
The Economist published the highlights from the Worldwide Cost of Living Survey conducted by The Economist Intelligence Unit just recently. According to the research, Singapore is still the most expensive city globally, followed by Paris, Zurich, Hong Kong, Oslo, Geneva, Seoul, Copenhagen, Tel Aviv and Sydney on the top 10 list. Check out the article to see the full Cost of Living Index chart that compares prices in 130+ cities and shows how they’ve changed since a decade ago (with New York as the benchmark city).
Top 25 Countries with Most Billionaires
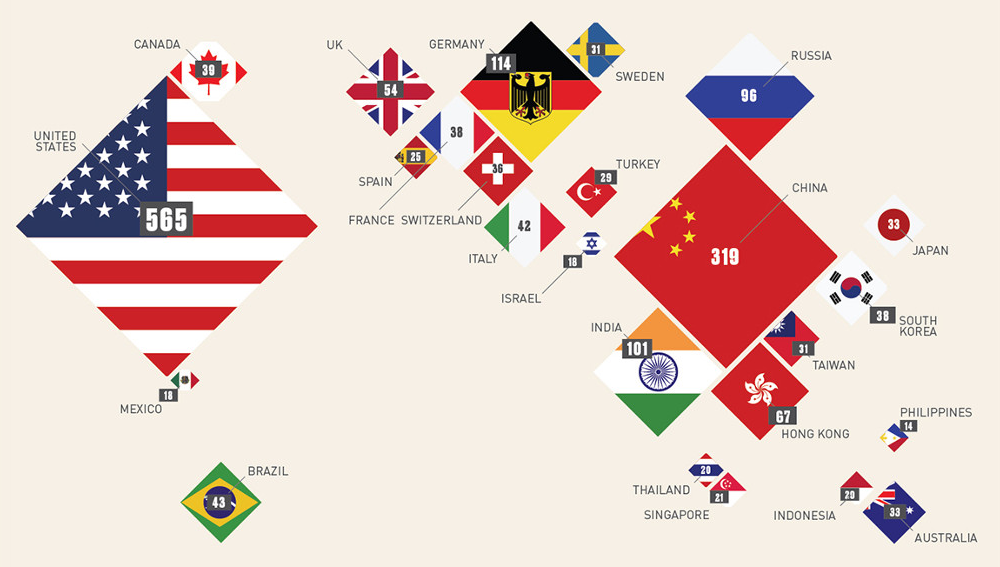
Visual Capitalist shared an infographic that presents the top 25 countries with the biggest number of billionaires. The United States, China, Germany, India and Russia take the lead here. For each of the top 25 countries, the infographic also shows the population-per-billionaire ratio and tells more about their richest people.
***
In conclusion, we are also glad to invite you to check out a new article within the framework of the ‘Challenge AnyChart!‘ feature. It’s a tutorial on how to add a custom technical indicator to a JavaScript (HTML5) stock chart.
Thanks for your attention! Have a great weekend!
- Categories: Data Visualization Weekly
- No Comments »