 Fall is an amazing time for TV, movie, theater, and other art lovers as that’s when a lot of premieres are being launched. Well, we are happy to contribute to the debut mainstream this time! Meet AnyChart 8, a modular JavaScript charting system taking the convenience, performance, and customization in the art of interactive data visualization to the next level.
Join us in reviewing the core innovations delivered in the 8th, module-based generation of AnyChart, including the brand new features now available in our JS charting libraries AnyChart, AnyStock, AnyGantt, and AnyMap, as well as what else is in our nearest plans.
AnyChart JS Charts 8.0.0: Modules, Custom Builds, and Much More
The 8.0.0 release of the AnyChart, AnyGantt, AnyMap, and AnyStock JavaScript (HTML5) charting libraries delivers a lot of brand new features and technical improvements. Please see the list below for a quick overview of what’s new.
 |
Modular JavaScript SystemThe core general innovation of AnyChart 8 is a modular system. Connect only the features and chart types you really need so the JavaScript on your web page or in your app be much more lightweight. AnyChart 8 has a dedicated JavaScript builder and works seamlessly with Browserify, Webpack, and other bundling tools. |
 |
Custom JS BuildsCompile the features and types of chart you need in a single JS file with the quick help of our own JS Builder. AnyChart 8.0.0, now modular JavaScript charting solution offers 30 modules along with 16 chart design themes. Your license key can also be included in a build. |
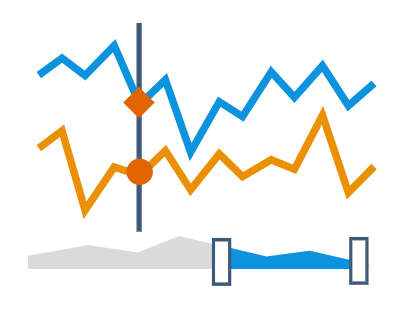 |
Crosshair in Stock ChartsUse the Crosshair tool in charts powered by AnyStock to display exact values in data points. In this way, you’ll facilitate the exploratory analysis of the stock, financial, and any other date and time-based data. Depending on your specific data visualization needs, you can choose float or sticky crosshairs available out of the box. |
 |
Current Price Indicator in Stock ChartsHighlight values for certain dates with the help of the Current Price Indicator that we’ve added to AnyStock. For example, you can use it as an exploratory tool to emphasize the most important reference points, mark the current and (or) last available dates, and so on. |
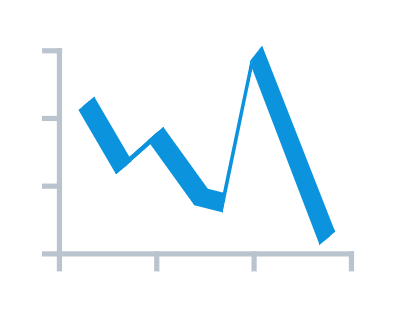 |
3D Line Chart in Basic ChartsPick the 3D Line Chart when you need it for the purposes of your data visualization. Now it’s added to multiple dozens of chart types available in our JavaScript charting libraries out of the box. |
 |
Node.js Server-side RenderingMake use of our lightweight Node.js server via API to create charts in vector (PDF, SVG, and PS) and bitmap (PNG, JPG, and TIFF) formats, as well as reports in PDF, and raw data presentations in CSV and Excel’s XLSX. It runs seamlessly on Linux, macOS, Windows, and is easy to install and configure. Input data is taken from XML and JSON configs and JS. Our Node.js server is a perfect solution for building reporting systems sending charts and dashboards via email as well as social network sharing tools. |
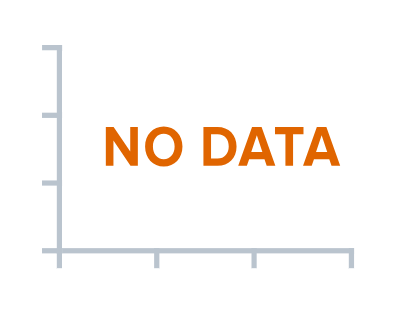 |
No Data Label FeatureEnable a No Data label (demo) informing that some data is not displayed: is missing from the beginning or was removed via the Data Updating API, Exclude Data Point feature, or interactivity. |
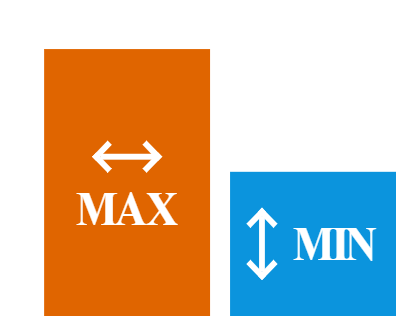 |
Data Points Size Settings in Basic ChartsKeep the size of data points in basic charts under your absolute control like in this chart sample. Now you can assign points a fixed size in the series added dynamically (chart.pointWidth()) and width when data is updated (chart.maxPointWidth()), as well as make sure that even tiny values are not missed out (chart.minPointLength()). |
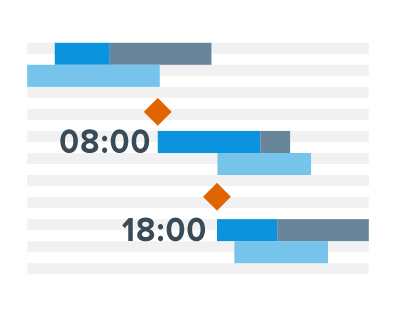 |
Timeline Labels Settings in Gantt ChartsEnjoy the cutting-edge flexibility of the timeline text formatting in AnyGantt. In particular, we’ve added baseLabels(), baselineLabels(), parentLabels(), milestoneLabels(), and progressLabels() methods, as well as remastered the labels() method to make it helpful in setting the defaults for any label type. See the Styling Labels demo in the AnyGantt gallery. |
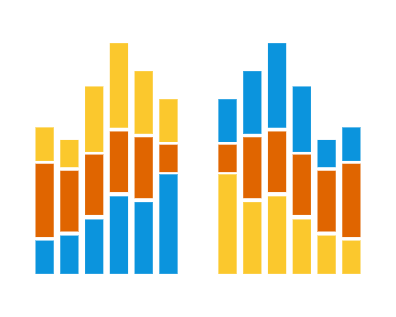 |
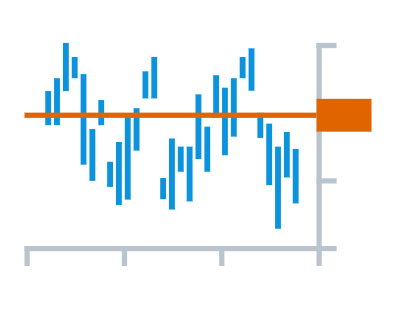
Series Stacking Order in Basic ChartsArrange the series in Stacked Charts in the order you need with the help of the stackDirection() method. This can help when you load data from a third-party source and cannot control the format of the input data. |
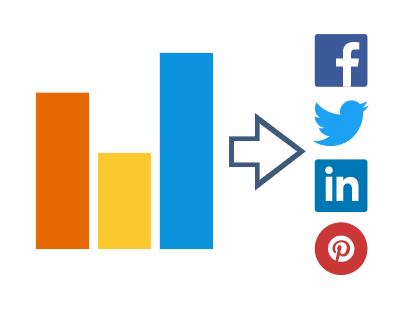 |
Chart Export SettingsConfigure the export settings (API reference) for every certain chart you have, including descriptions and links for Facebook sharing, image exporting options, and others. |
 |
CSV/Excel Export ReworkedGet your CSV and XSLX (Excel) data prepared in an improved way as we’ve remastered this algorithm. Now you’ll be able to load different series with multiple data sets and to be sure that the features specific to a particular chart type are taken into account. |
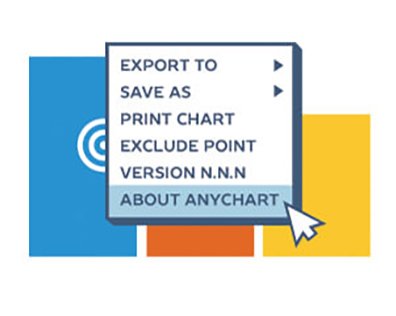 |
Context Menu Customization APICustomize a context menu in a more streamlined way. Each item of the context menu is given an ID that you can refer to in order to modify the corresponding settings and fields and add custom ones when needed. Also, the context menu localization is now available. |
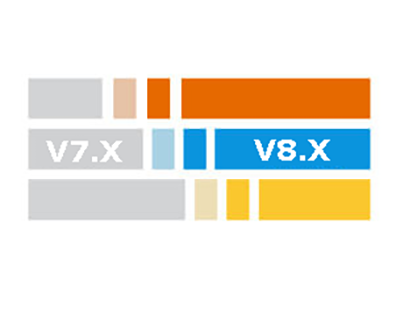 |
General API ImprovementsAdjust Appearance settings, Grids settings, and Data Mapping settings even easier. The AnyChart API is now significantly improved and tailored to the 8th, modular JavaScript system based generation of AnyChart JS Charts. We’ve also created a Migration Tool to simplify the AnyChart 7 to AnyChart 8 upgrade and make the transition semi-automatic for most of our users. |
Other Improvements in AnyChart JS Charts 8.0.0
You’ve seen that in addition to the modular JavaScript nature we introduced a lot of new charting features that make AnyChart even more powerful and robust in its new generation. Of course, we’ve also made a number of minor improvements and bug fixes that are nonetheless very important.
Check out the version history of the JS charting library (or libraries) that you use to read the information about all the relevant changes. For your convenience, here are the links to the version histories: AnyChart, AnyStock, AnyMap, AnyGantt.
Expect AnyChart 8.1.0 in December 2017
While the 8.0.0 release has brought multiple improvements and innovations to our JavaScript charting libraries, we already know how to make them even better. Version 8.1.0 is scheduled for December 2017 and will be the next awesome news for our customers. In particular, we are going to roll out meaningful improvements to the Data API which is common for all our components, as well as add label annotations to basic and stock charts, event markers to stock charts, brand new timeline to Gantt charts, refined labels to pie charts, and further boost to the big data charting performance.
Meanwhile, please enjoy AnyChart JS Charts 8.0.0, a set of advanced, now modular JavaScript charting libraries!
If there is any new feature or chart type that you need for completing your data visualization tasks, feel free to send a corresponding request to our Support Team and there is a good chance that we will include it in our nearest plans. Here’re the links to our libraries’ roadmaps, just in case: AnyChart, AnyStock, AnyMap, AnyGantt.
- Categories: AnyChart Charting Component, AnyGantt, AnyMap, AnyStock, Dashboards, Financial Charts, Gantt Chart, HTML5, JavaScript, News, Stock Charts
- 5 Comments »
Comments (5)
Impressive release, guys!
When is https://cdn.anychart.com/js/latest/anychart-bundle.min.js supposed to be updated to version 8 as well?
I refreshed it several times and it still show Version: 7.14.3.1436
Thanks,
Cristian
Cristian,
we intentionally did not upgrade the latest to 8.0.0, this version is incompatible with 7.x and a lot of people (sadly) uses the “latest” link in their production environment. We don’t want them to suffer cause the chance if their charts stopping to work is great. We have moved to strongly versioned links like https://cdn.anychart.com/releases/8.0.0/js/ and we are thinking of doing this like that from now on. Probably we reintroduce /latest/ in some way later.