![]() Here are the spring May flowers we promised. After the hard work put in over the past months, we’re happy to announce that the 7.14.0 release of our JavaScript charting libraries AnyChart, AnyStock, AnyMap, and AnyGantt is out and ready to download! It brings you new cool features and important improvements that will make your data visualization life even better.
Here are the spring May flowers we promised. After the hard work put in over the past months, we’re happy to announce that the 7.14.0 release of our JavaScript charting libraries AnyChart, AnyStock, AnyMap, and AnyGantt is out and ready to download! It brings you new cool features and important improvements that will make your data visualization life even better.
Now, we invite you to discover all the new JavaScript/HTML5 charting capabilities that the 7.14.0 version of AnyChart’s data visualization software product family has to offer to you. Here’s a quick overview…
New in JavaScript Charting Libraries: AnyChart 7.14.0
The 7.14.0 release comprises a lot of new features and chart types, and not only. See the list below to learn more about what’s new.
1. New JavaScript Chart Types in 7.14.0
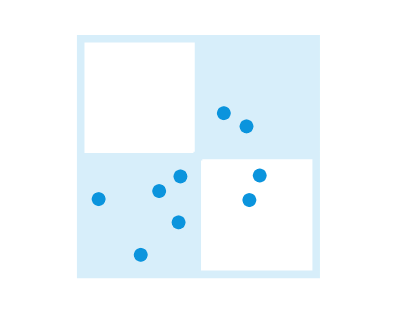 |
Quadrant Chart Quadrantize discrete data for making better decisions when choosing between multiple alternatives. The new Quadrant Chart type now available in AnyChart out of the box allows for quickly categorizing and prioritizing information. Check out Quadrant Chart samples: Comparison of Business Intelligence (BI) Software, Eisenhower Matrix, SWOT Analysis, and Categorization of Scattered Data. |
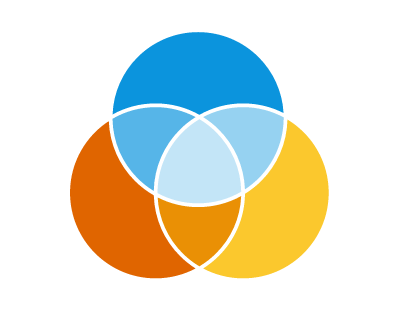 |
Venn Diagram Reveal similarities and nesting relationships between different sets with ease by visualizing data on a Venn Diagram. This JavaScript chart type graphically represents data as overlapping circles, which is helpful in contrasting and categorizing diverse groups of things – see the charting examples. |
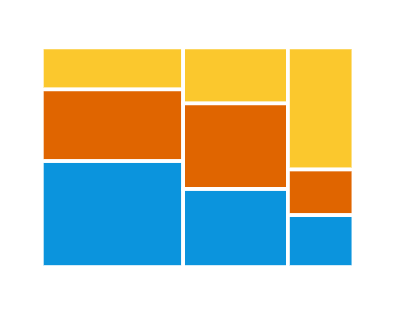 |
Mekko Chart (Marimekko Chart) and Mosaic Chart Enable multidimensional overview of data by using the Mekko Chart and Mosaic Chart types. Featuring two categorical (ordinal) axes, both X and Y, they work well for exploring relationships between different variables, e.g. visualizing product sales for multiple categories, how skills are distributed across jobs, etc. – check out Mekko Chart and Mosaic Chart samples. |
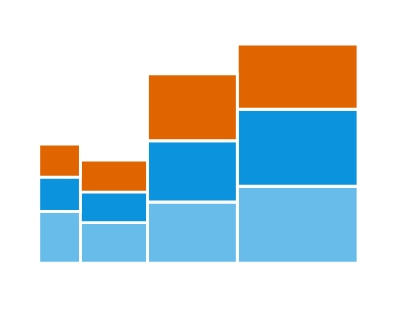 |
Bar Mekko Chart Focus on only one segment of data while staying on a Mekko plot by letting in the Bar Mekko Chart type. It is nicely suitable for adding trendlines and displaying both positive and negative values. |
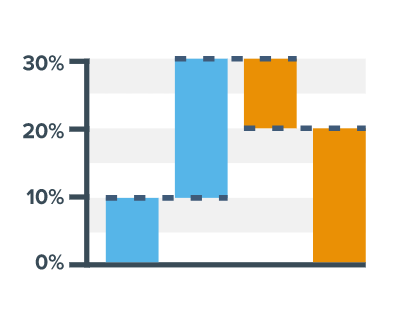 |
Waterfall Chart Display the cumulative effect of values, both positive and negative, that are introduced sequentially. The new Waterfall Chart type is a great instrument of exploring processes, e.g. research, production, sales, and so on. NB: the AnyChart library can get data both as absolute values and as deltas – see the Waterfall Chart samples. |
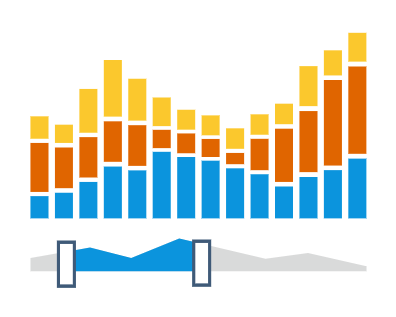 |
Stacked Stock Chart Show the cumulative, total value of all series in every period of time on a Stock Chart by applying data to the new Stacked Stock Chart type. Basically, the stacking data visualization technique is not used in financial charting. But Stock Charts are often utilized for purposes other than financial data analysis, and that’s where stacking can be helpful. For example: sales, web traffic, and any other timeline data over a long time. |
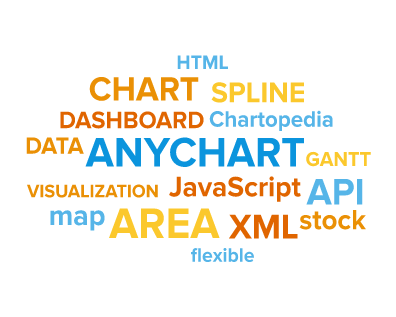 |
Tag Cloud (World Cloud) Represent text data graphically with the help of Tag Clouds (or Word Clouds). This form of visualization is now also available in AnyChart out of the box (see some samples). A Tag Cloud can be useful for quickly revealing words, keywords, tags, etc. that occur most frequently in any certain body of text. Our solution provides color scale based categorization, numerous ways to arrange words, and extensive interactivity settings. |
2. New JavaScript Charting Features and Tools in 7.14.0
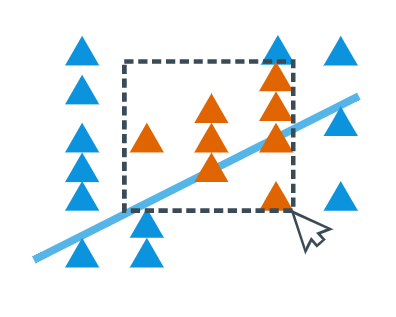 |
Marquee Select and Zoom Make exploratory data analysis easier by using Marquee Select and Zoom tools in the AnyChart and AnyStock JavaScript charting libraries. You can also integrate them with a custom UI with the help of events in order to make your interactive JavaScript charts even more consistent and intuitive. |
 |
Google Spreadsheets Data Loader Load data into JavaScript charts and dashboards directly from Google Spreadsheets with the help of our Data Adapter. Google Spreadsheets is widely used as a data source, so we’ve made it possible to easily get data out of it – from any publicly shared document – into JavaScript charting libraries AnyChart, AnyMap, AnyStock and AnyGantt. |
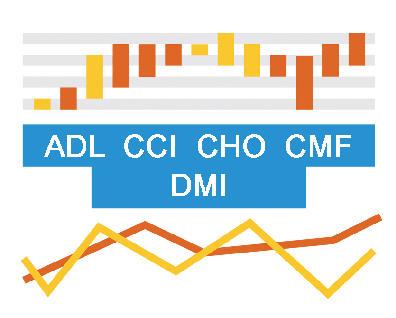 |
5 New Technical Indicators Boost the technical analysis by making use of 5 new technical indicators introduced in our AnyStock JavaScript charting library with the 7.14.0 release: Accumulation Distribution Line (ADL), Commodity Channel Index (CCI), Chaikin Money Flow (CMF), Directional Movement Index (DMI) and Chaikin Oscillator (CHO). As of now, AnyStock features a total of 21 fine-tuned technical indicators! |
 |
Text Wrap (‘byWord’) Format texts on your JavaScript charts in a better way with the help of the Text Wrap ‘byWord’ feature just added to the AnyChart library by popular request. This will allow you to make sure the entire output wording looks cute and is especially print-friendly. |
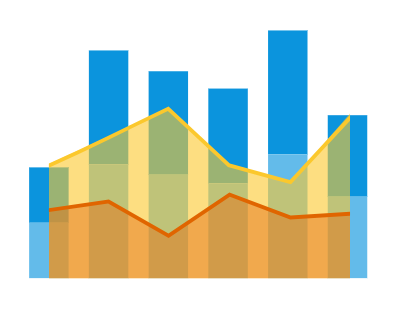 |
Scale Sync Synchronize the scales when depicting different kinds of data on a single interactive JavaScript chart. The new Scale Sync feature is now available in AnyChart so you can build good-looking complex data visualizations and even add stacked series without making a mess of the whole presentation. For example, this combined chart utilizes Scale Sync. |
3. Other Improvements in AnyChart JS Charts 7.14.0
In addition to so many new JavaScript (HTML5) charting tools and features and chart types introduced with the 7.14.0 release, we’ve also made a number of minor but still very important improvements, bug fixes, and JavaScript Charting API optimizations. You’ll find comprehensive lists of changes in the version histories of the libraries you are using, here are quick links to those sections: AnyChart, AnyStock, AnyMap, AnyGantt.
Expect AnyChart 8.0.0 in Fall 2017
To sum up, the 7.14.0 update of our JavaScript charting libraries is huge, bringing you a lot of new cool stuff to further ease and improve the data visualization experience. And the 8.0.0 release is going to be another awesome news! Scheduled for fall 2017, it will feature the Plugins and Modules System, Node.js based server-side rendering, and a lot of major general API improvements.
So, enjoy AnyChart 7.14.0!
Please also let us know if you want any new chart type or feature for your data visualization needs. We’ll be happy to consider adding it to our roadmaps (quick links: AnyChart, AnyStock, AnyMap, AnyGantt). And you might even get it with the next release.
Thanks for staying with us! Happy JavaScript charting!
- Categories: AnyChart Charting Component, AnyGantt, AnyMap, AnyStock, Business Intelligence, Dashboards, Financial Charts, Gantt Chart, HTML5, JavaScript, News, Stock Charts
- 7 Comments »
Comments (7)
Are all charts and types available for qlik now
Sajid, only the chart types shown on our AnyChart Extension for Qlik Sense page are currently available in Qlik. But, of course, we do plan to gradually add more. Could you please tell us what chart types you would like to get first? We’ll be glad to consider delivering them asap.
Andrey, let me jump in the conversation.
Not sure if it is possible (I didn’t find those chart under the link you provided), but..
– It would be grate to see Combo chart (with two Y axis), with TWO dimension and multiple measures
– TRELLIS chart with TWO dimensions and MULTIPLE measures
Gleb, thank you for the suggestions. By popular request, our near-term plan now includes a big update for Qlik scheduled in September 2017 within the framework of the 7.15.0 release of our JavaScript charting libraries. It is expected to deliver these and other chart types. We appreciate your participation.