Several experts and sources say William Playfair deserves credit for the development of the first bar chart in 1786. However, this statement appears to be misleading, or if not wrong, at least just a part of the truth.
If we get down to the bare facts, one of the greatest thinkers and scientists of the Middle Ages, Nicole Oresme, used a bar chart more than 300 years before Playfair, in his publication titled The Latitude of Forms (14th century). Oresme decided to plot velocity of a constantly accelerating object against time, and here is what he drew:
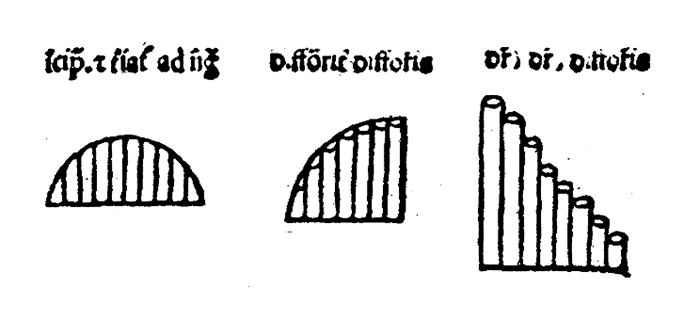
These were the first bar charts in history!
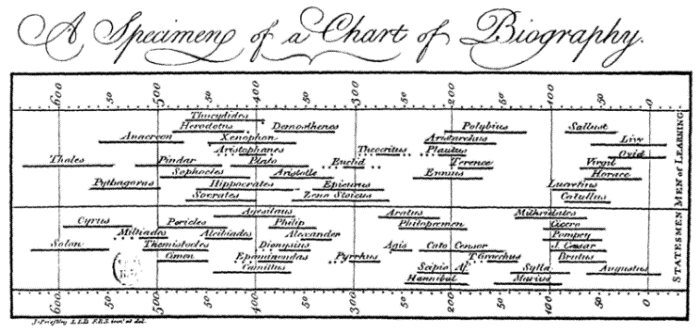
Moreover, two decades before Playfair, in 1765 Joseph Priestley designed A Chart of Biography to serve as visual study for his Lectures on History and General Policy. He used individual horizontal bars to visualize the life span of a person and the whole chart to compare the life spans of multiple persons. Although it is more of a timeline chart, it can still be considered to be a bar chart, too.
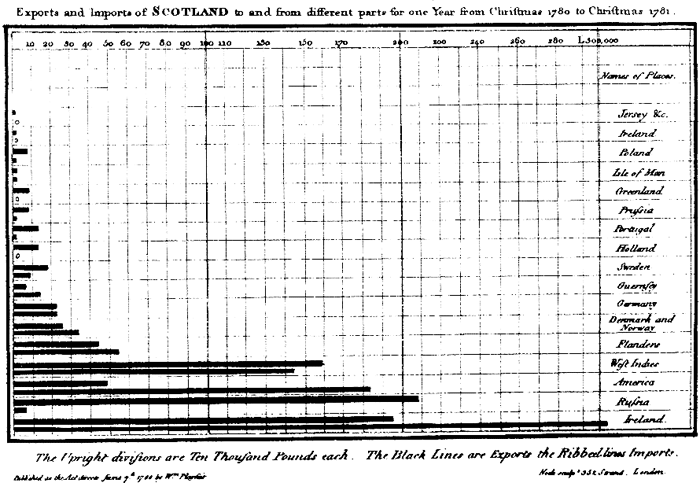
But what about William Playfair? In 1786 he published The Commercial and Political Atlas with a chart Exports and Imports of Scotland to and from different parts for one Year from Christmas 1780 to Christmas 1781, and this bar chart form looks much more usual to us today.
James R. Beniger and Dorothy L. Robyn explain:
This bar chart was the first quantitative graphical form that did not locate data either in space, as had coordinates and tables, or time, as had Priestley’s timelines. It constitutes a pure solution to the problem of discrete quantitative comparison.
So, even if William Playfair was not the one to invent the bar chart, we must admit at least his pioneering role in implementing and popularizing the idea of graphic depiction of quantitative data and still being one of the first bar chart makers in history.
References:
– Arthur Sheps (1999). Joseph Priestley’s Time Charts: The Use and Teaching of History by Rational Dissent in late Eighteenth-Century England. Lumen: Selected Proceedings from the Canadian Society for Eighteenth-Century Studies, 18
– Geoff Der, Brian S. Everitt (2014). A Handbook of Statistical Graphics Using SAS ODS. Chapman and Hall/CRC
– James R. Beniger and Dorothy L. Robyn (1978). Quantitative graphics in statistics: A brief history. The American Statistician, 32
– Jürgen Symanzik, William (Zelli) Fischetti, Ian Spence (2009). Commemorating William Playfair’s 250th Birthday. Utah State University
- Categories: Interesting Facts
- 3 Comments »