 Gantt charts are among the most effective ways to visualize tasks, timelines, and dependencies, making them a core component of modern project management practices. For developers building web applications, the right JavaScript Gantt chart library can dramatically save development time and deliver a professional, interactive experience directly in the browser.
The ecosystem in 2025–2026 includes a wide range of solutions — from free open-source libraries for simple timelines to enterprise-grade components with advanced scheduling engines and resource management features. Some prioritize speed and simplicity, while others focus on deep functionality and seamless integration into broader charting or UI stacks.
This article reviews the most notable JavaScript Gantt chart libraries available today. Each library is presented with its functionality, performance and scalability, integration options, licensing, and support. Whether you are building an internal tool, a SaaS application, or a full-scale enterprise system, this guide will help you quickly identify the Gantt solution that best fits your needs.
What Is Gantt Chart?
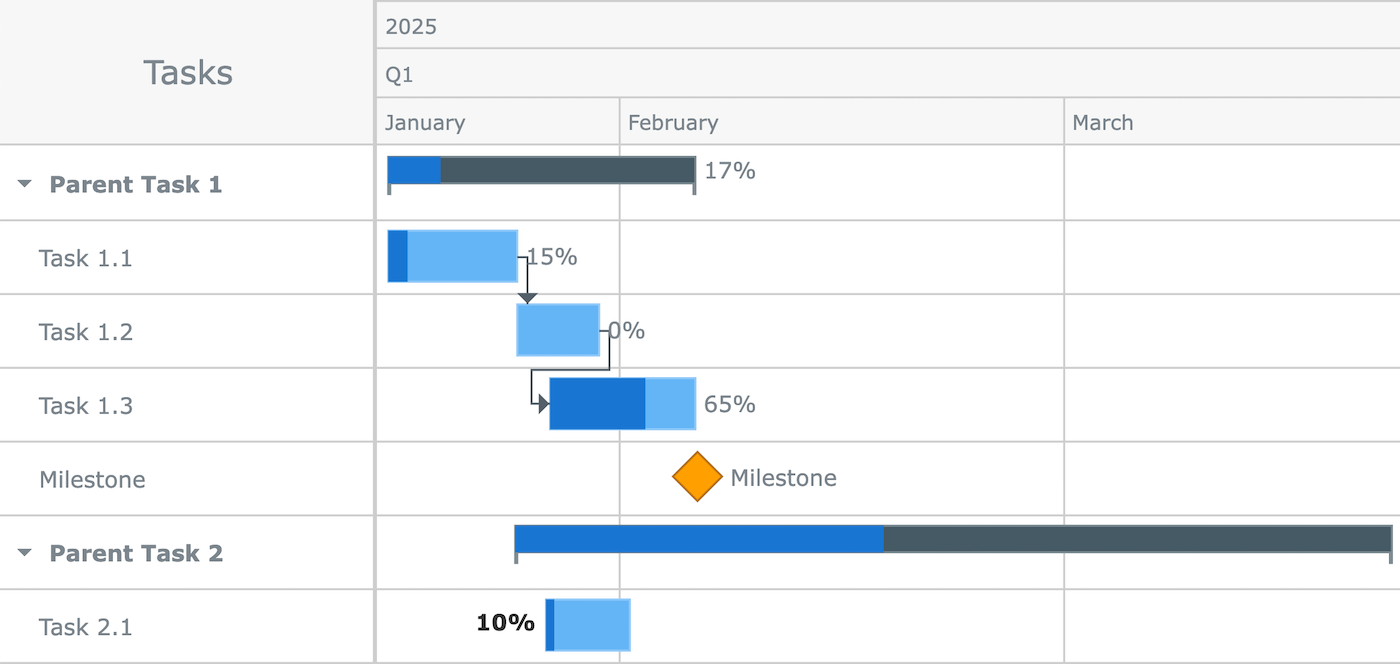
Standard Gantt chart composition
A Gantt chart is a type of data visualization focused on timelines, widely used in professional project management and task scheduling. It displays tasks along a horizontal time axis, showing when each task starts and finishes, how long it should take, and how tasks relate to each other. Dependencies between tasks are typically drawn as connecting lines, so it becomes clear which tasks must be completed before others can begin.
Modern Gantt charts also go beyond static timelines. They often include milestones, baselines, percent-complete indicators, and even resource views that show how people or assets are allocated. This makes them useful not only for project managers but also for developers, analysts, and teams who need to visualize structured workflows.
For web applications, JavaScript-based Gantt chart libraries allow these visualizations to be interactive and dynamic. Users can drag tasks to reschedule them, resize them to change durations, or create dependencies with a few clicks. A good Gantt chart library brings these features to the browser with smooth performance, making project timelines accessible directly inside web tools and dashboards.
How to Choose JavaScript Gantt Chart Library
Not every Gantt chart library is suited for every project. Some are lightweight, perfect for prototypes and internal tools, while others provide full-scale project management features and enterprise-grade scheduling engines. Before deciding, developers should consider several key factors.
1. Features
Start by checking whether the library supports the essentials: task hierarchies, dependencies, milestones, and baselines. Advanced options like critical path analysis, resource allocation, or auto-scheduling may be indispensable for complex enterprise scenarios but unnecessary in smaller apps.
2. Interactivity and Performance
For end users, smooth interactivity matters. Drag-and-drop editing, inline task updates, and virtual scrolling for large datasets directly affect usability. If your projects involve thousands of tasks, make sure the library is optimized for large-scale rendering.
3. Technical Integration
A practical library should fit into your stack easily. Look for npm packages, ES modules, and integration templates or wrappers for frameworks like React, Angular, or Vue. For backend-heavy applications, features like server-side export can also matter.
4. Licensing and Cost
Licensing models vary widely. Some libraries are open source under MIT or GPL, while others are commercial with per-developer or subscription pricing. Consider whether you need OEM redistribution rights, startup discounts, or free licensing for personal use.
5. Documentation and Support
Clear documentation with code samples, a gallery of examples, and an active support channel can significantly speed up development. Enterprise projects especially benefit from commercial support contracts and regular maintenance updates.
By weighing these factors, teams can align their choice of Gantt library with both their technical requirements and budget realities.
Top JavaScript Gantt Charting Libraries
AnyChart Gantt (AnyGantt)
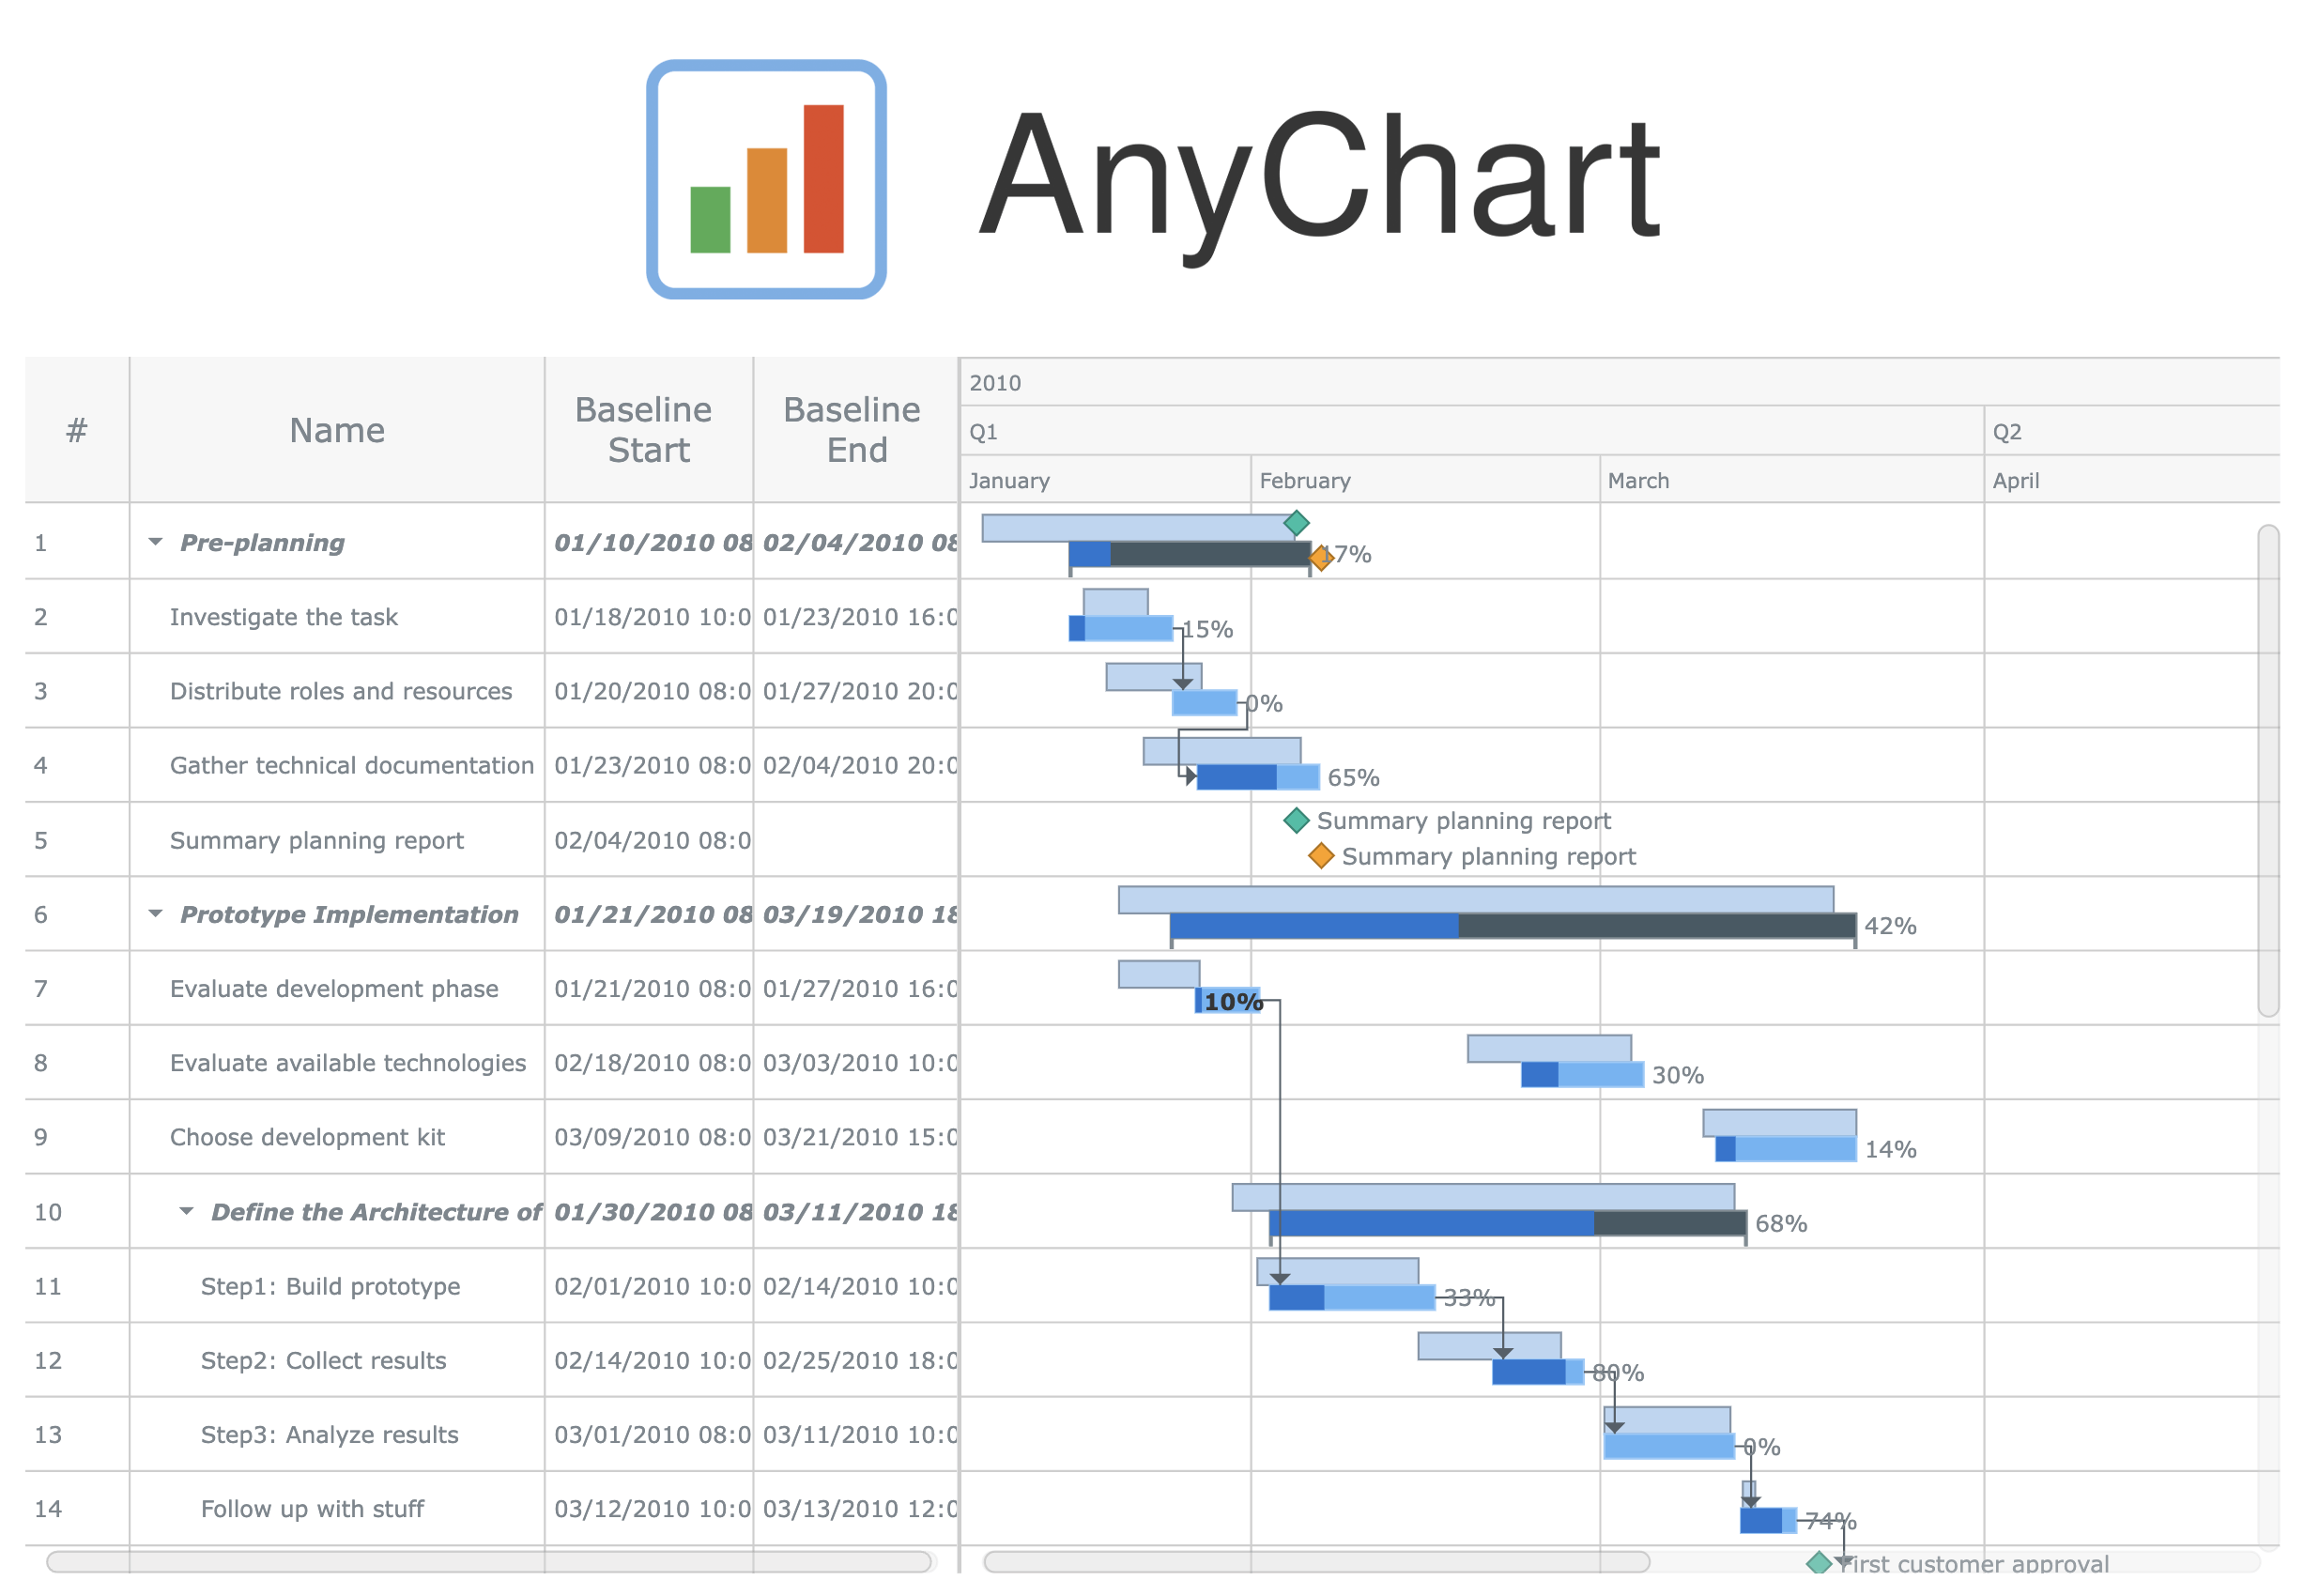
AnyChart JavaScript Gantt Chart
AnyGantt is a JavaScript Gantt chart library developed and supported by AnyChart. It allows developers to visualize both project-oriented and resource-oriented schedules, making it possible to track task progress over time as well as workload distribution across teams and assets. While AnyGantt is part of the larger AnyChart JS Charts suite, it can function independently and is widely used on its own — for example, to add a single Gantt chart into a website or business application without requiring the rest of the suite. Being part of the AnyChart product family gives teams a consistent JavaScript API and styling when they also need other charts.
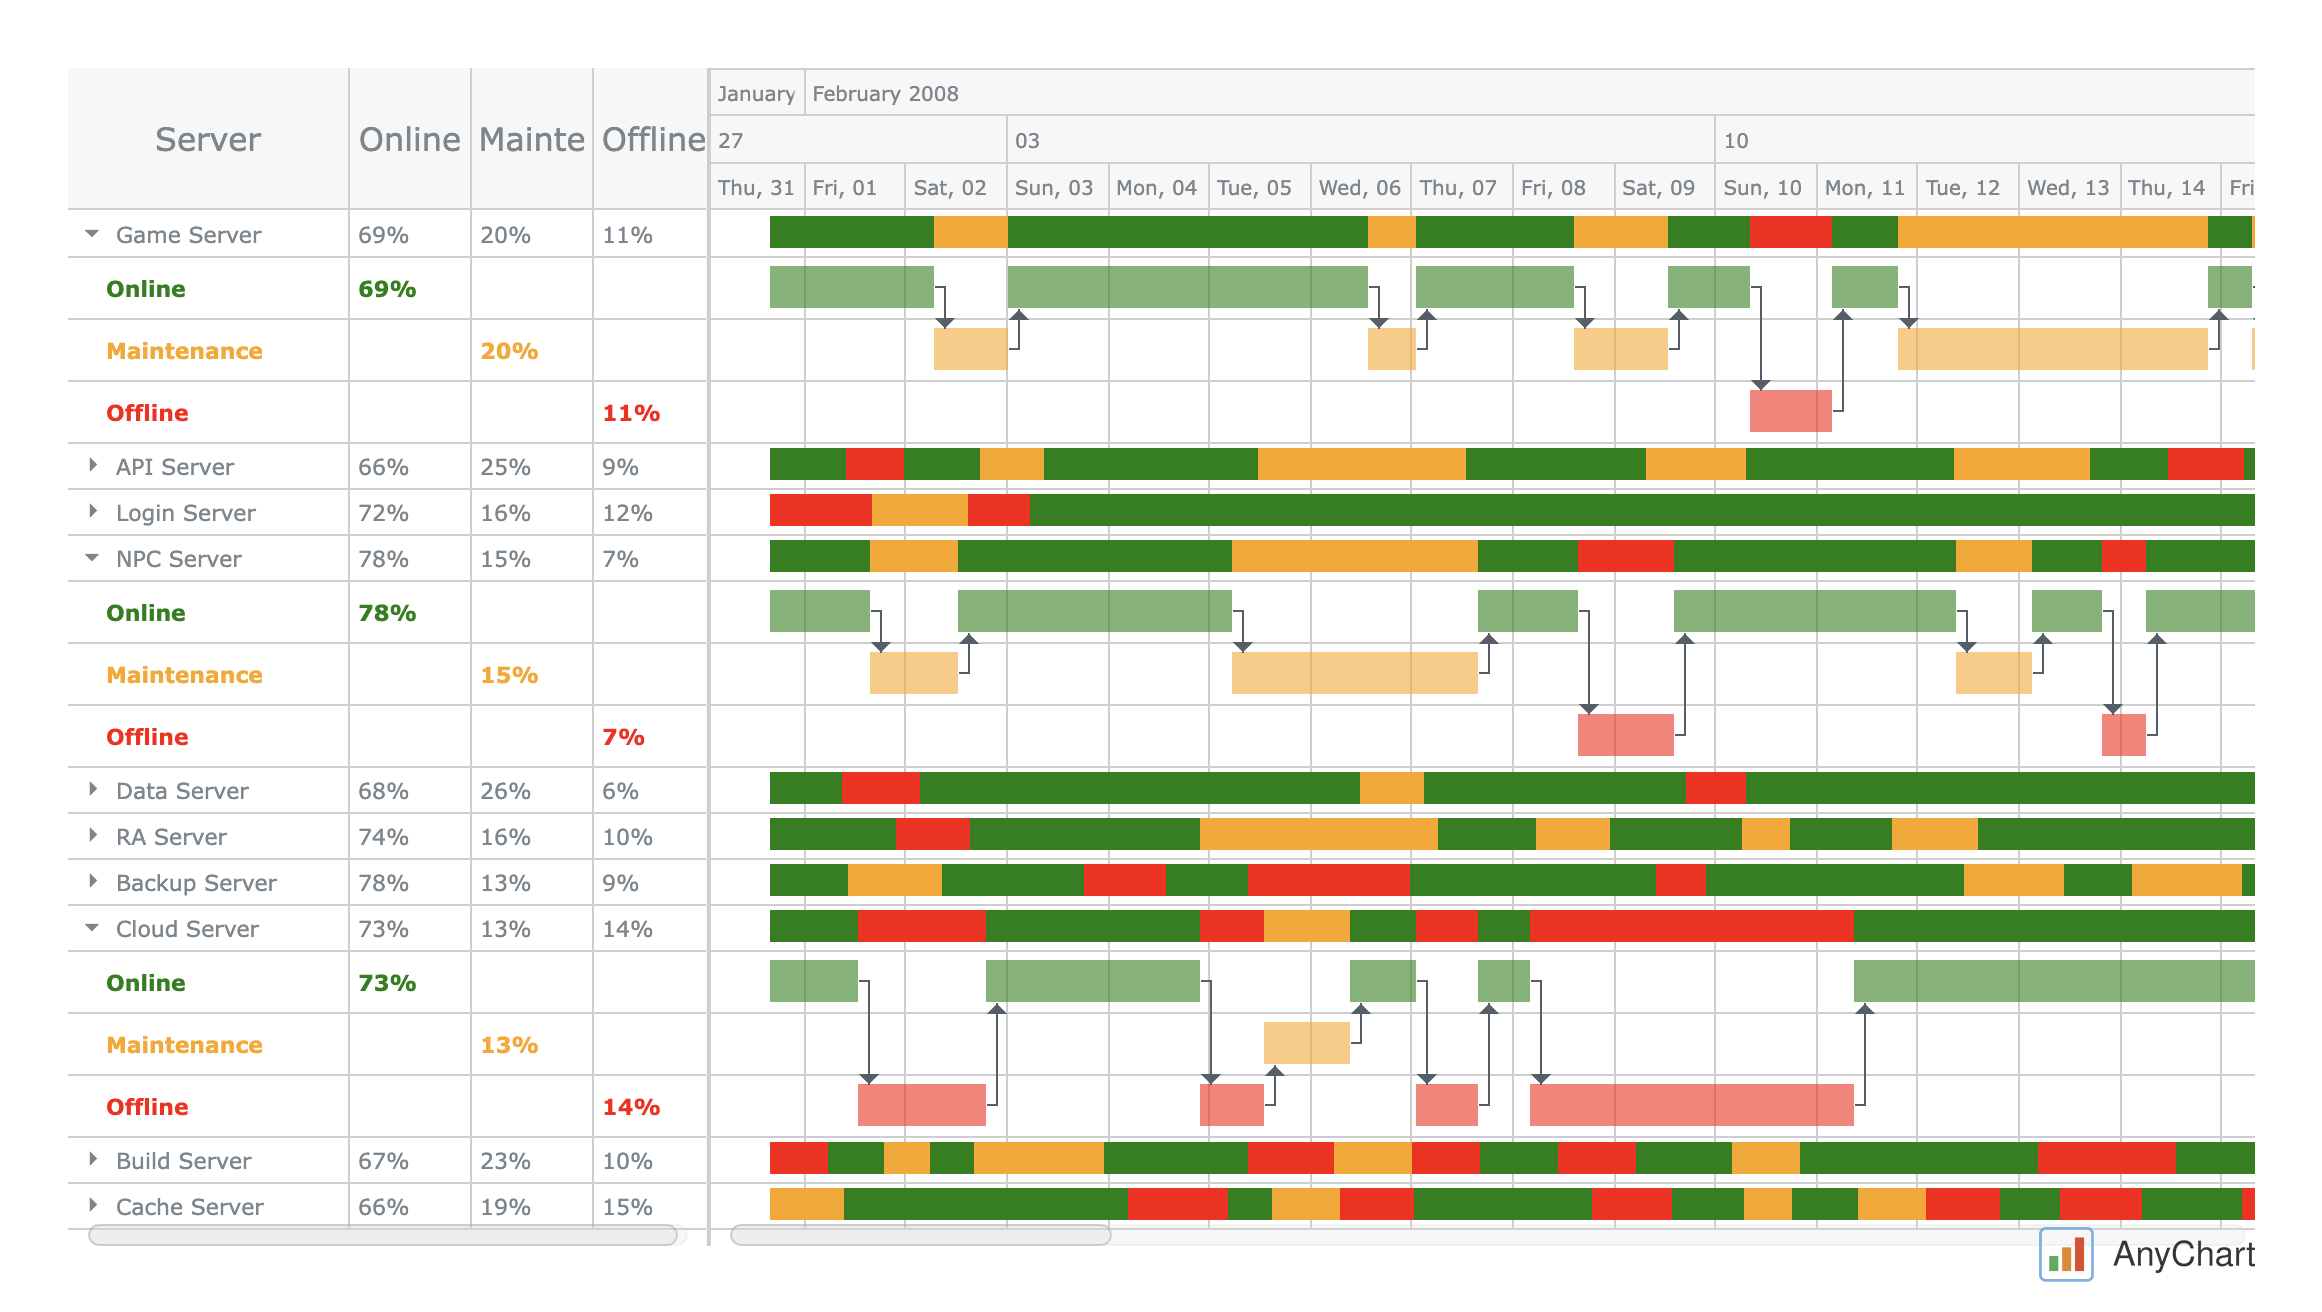
AnyChart JavaScript Resource Gantt Chart
In terms of functionality, AnyGantt covers the essentials required for project planning and timeline management. Developers can create task hierarchies, set milestones, and define dependencies to mirror real workflows. Baselines and percent-complete indicators are available for tracking progress, and interactivity is strong: tasks can be dragged, resized, or linked directly on the chart. Large datasets remain performant, and exporting is robust, supporting not only PNG, PDF, and SVG, but also CSV and Excel for data-level reporting.
Key Features
- Project and resource Gantt views
- Dependencies, milestones, and baselines
- Live editing with drag-and-drop
- Export to multiple formats, including Excel and PDF
Integration
AnyGantt is designed to integrate with any technology stack. It can be included via npm or script tags and is framework-agnostic. To speed up development, ready-made templates are available for popular frontend frameworks like React, Angular, and Vue, along with integration samples for major programming languages including PHP, Python, Java, .NET, and more, as well as widely used databases such as MySQL and MongoDB. For backend workflows, AnyChart also offers an export server that renders charts server-side, a valuable option for enterprise environments.
Beyond the web, the library powers hybrid and native mobile applications on Android, iOS, and Ionic, and it is also available through dedicated Qlik Sense extensions for direct integration into BI dashboards.
Licensing
AnyChart is commercially licensed, with options tailored to websites, internal systems, SaaS, and OEM use. Importantly, there is also a free license for non-commercial projects and personal use, lowering the entry barrier for individuals, students, and hobbyists. For startups, the Next Unicorn license is available at $49 per product, making it affordable to adopt even at an early stage. Paid tiers include ongoing updates and support.
Strengths and Limitations
Focused on robust data visualization, AnyGantt strikes a balance between flexibility and ease of use. It is versatile enough for standalone Gantt use cases or as part of complex dashboards. Its export functionality and framework templates make it practical for enterprise teams and developers working across multiple stacks. Documentation is extensive, with many samples throughout, and the AnyChart support team is attentive and prompt.
At a glance:
- Best sides: project/resource views, robust export, easy integration, excellent documentation, responsive support, flexible licensing.
- Trade-offs: no built-in engine for advanced scheduling.
Best Use Cases
Best for dashboards, reporting platforms, SaaS products, and enterprise systems requiring a feature-rich yet integration-friendly Gantt solution with quick setup, versatile exports, and flexible licensing. Equally strong standalone or in a broader visualization stack.
Bryntum Gantt
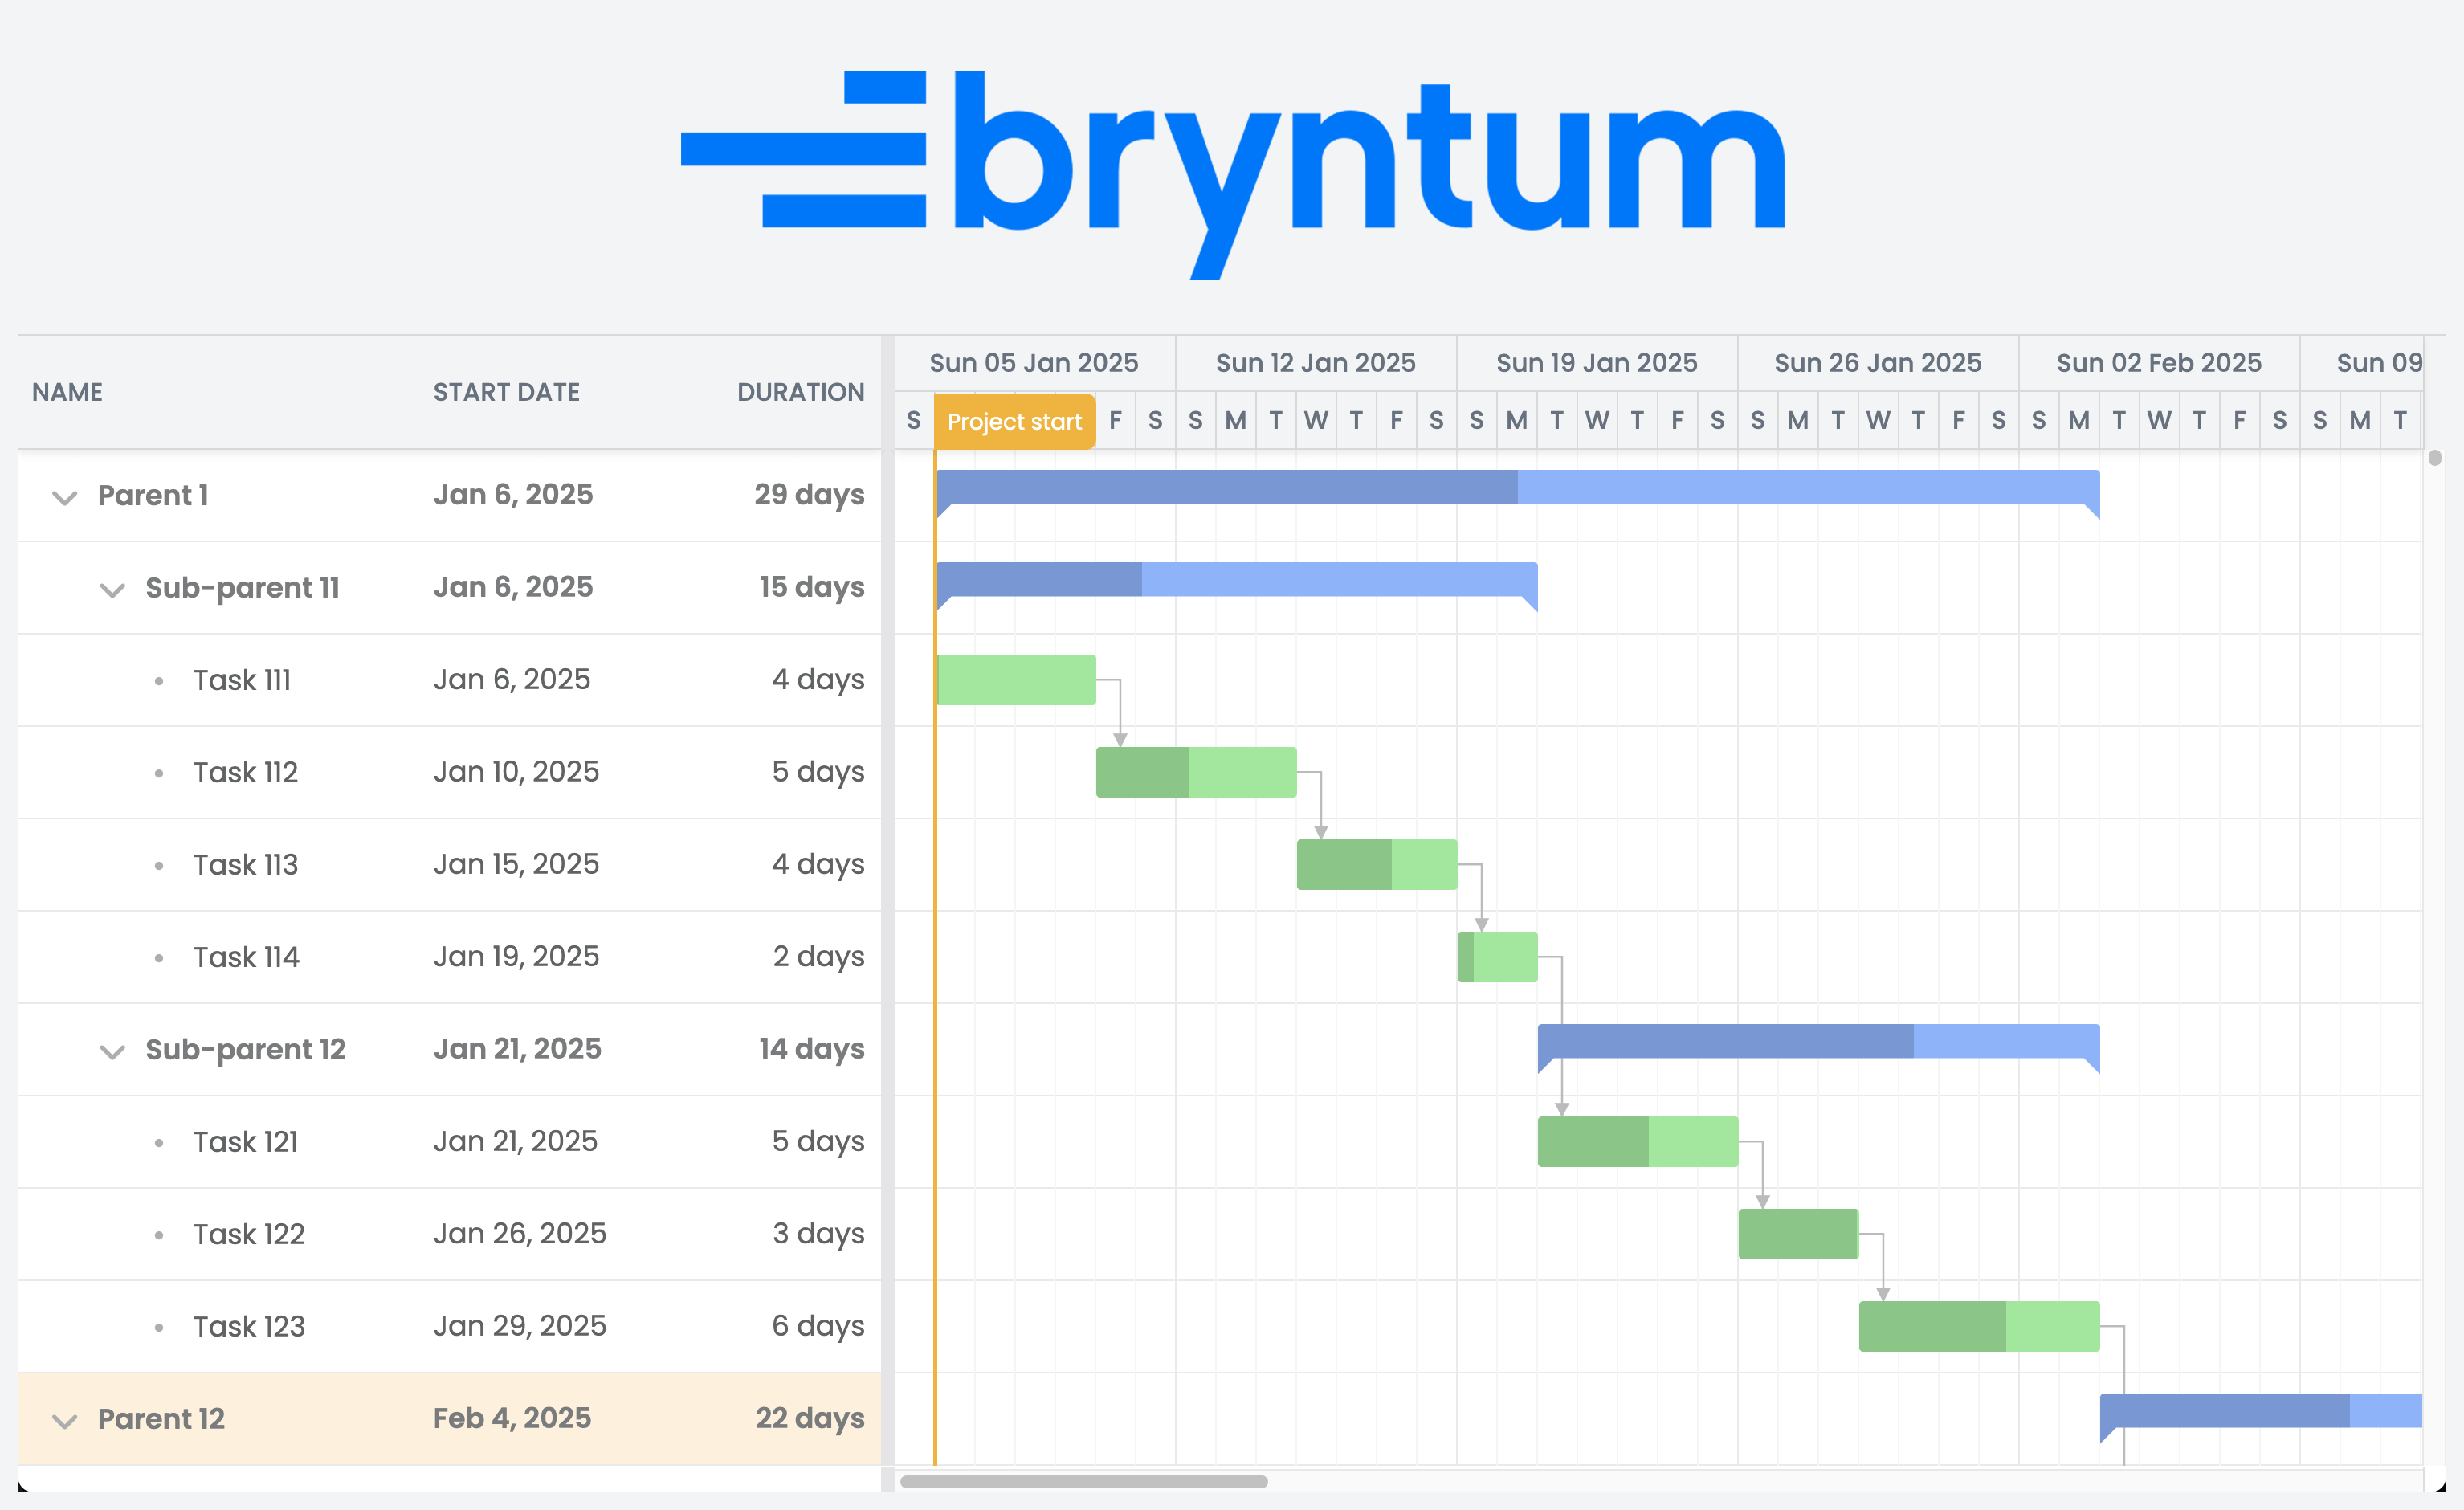
Bryntum JavaScript Gantt Chart
Bryntum Gantt is a specialized JavaScript Gantt library designed specifically for enterprise-grade scheduling. It ships with its own scheduling engine and a polished editing experience that resembles desktop project management software.
Its feature set is deep: developers can define dependencies with lags and leads, apply calendars, enforce constraints, and visualize baselines and critical paths. The grid-plus-timeline interface enables drag-and-drop editing, inline changes, and even undo/redo. Large datasets are handled through virtual scrolling and optimized rendering, keeping the experience responsive. Import and export options include Microsoft Project and Primavera, making it practical in enterprise workflows.
Key Features
- Scheduling engine with constraints and calendars
- Baselines, critical path, and progress tracking
- Polished grid + timeline editing with undo/redo
- Virtualization for large datasets
Integration
Bryntum provides official wrappers for React, Angular, and Vue. Developers can integrate it directly into framework-based apps, while backend connectivity is handled through its extensible CRUD manager. The examples library covers many real-world setups, helping teams shorten the learning curve.
Licensing
Bryntum uses a commercial per-developer licensing model. Licenses are perpetual, with one year of support and updates included. Pricing starts from around $940 per developer, and OEM distribution requires a separate license.
Strengths and Limitations
Bryntum Gantt is known for its powerful scheduling engine complemented by a polished UI. The documentation is detailed, and the large demo gallery covers a wide range of enterprise scenarios. Commercial support with SLA ensures reliability for mission-critical projects. However, the library is expensive and has a steeper learning curve, which can be excessive for simpler needs.
At a glance:
- Best sides: enterprise-grade scheduling, polished interface, strong performance, demo-rich documentation, SLA support.
- Trade-offs: high cost, steep learning curve, smaller community footprint.
Best Use Cases
Best for enterprise project management and ERP/CRM tools that need a native scheduling engine with constraints, calendars, and complex dependencies.
DHTMLX Gantt
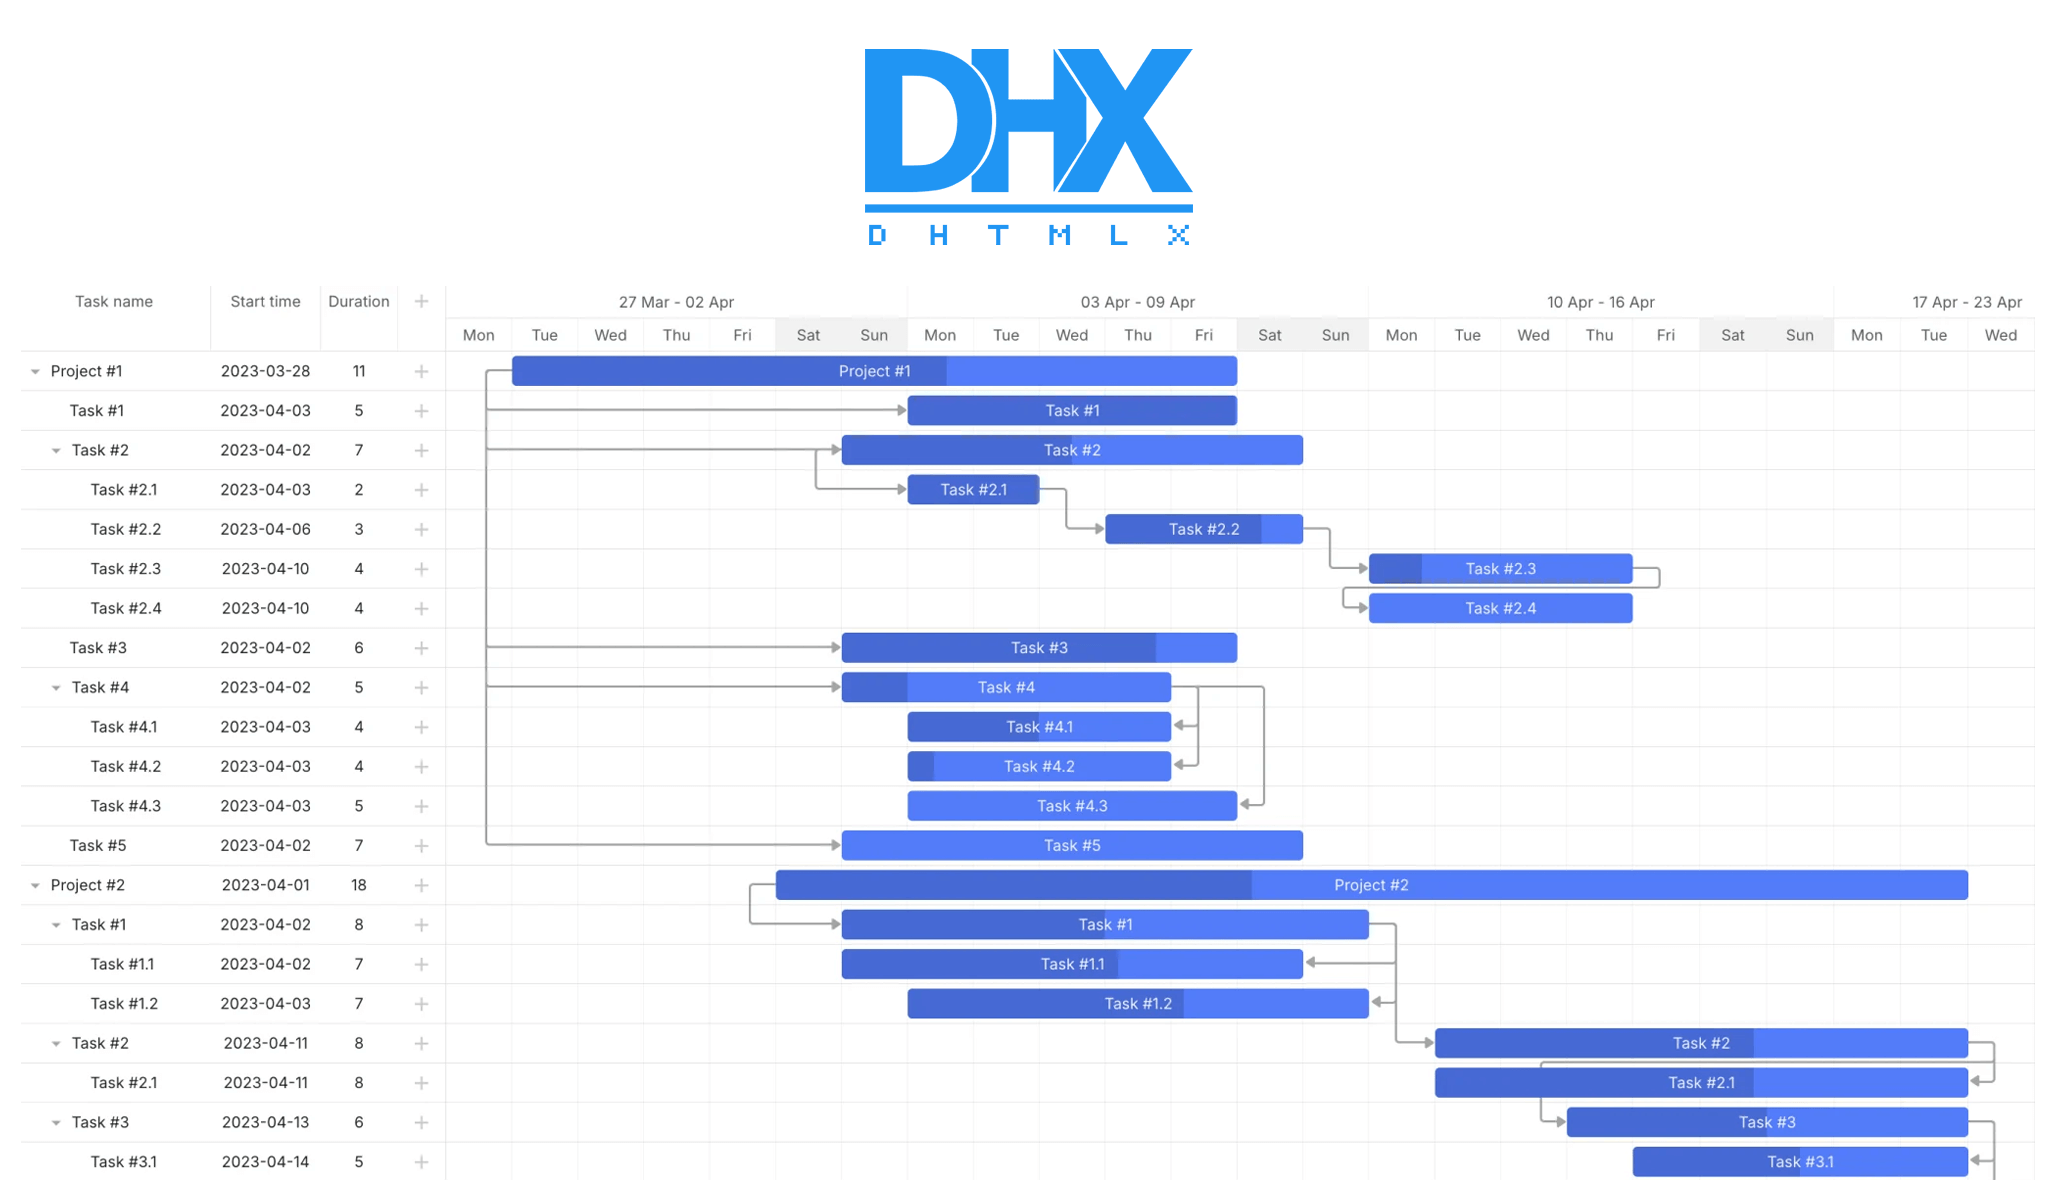
DHTMLX JavaScript Gantt Chart
DHTMLX Gantt is a long-established JavaScript Gantt chart library widely used in enterprise projects. It provides a mature balance of functionality, performance, and stability.
Its feature set includes auto-scheduling, critical path calculation, task splitting, and advanced constraints. Developers can create resource load diagrams and histograms to visualize workloads. Interactivity is rich: drag-and-drop editing, inline changes, and tooltips are supported. For scale, DHTMLX uses smart rendering and dynamic loading, keeping charts responsive even with thousands of tasks.
Key Features
- Auto-scheduling and critical path
- Resource charts and histograms
- Smart rendering for large datasets
- Drag-and-drop task editing
Integration
DHTMLX Gantt integrates with any stack, with official wrappers for React, Angular, and Vue available in PRO editions. It also provides numerous backend integration samples (PHP, Node.js, .NET, etc.), helping teams get up and running faster.
Licensing
The library is offered in two editions: a free Standard edition under GPLv2, suitable for open-source projects, and commercial PRO editions with advanced features and support. Commercial licenses are perpetual, with multiple support options.
Strengths and Limitations
DHTMLX offers a mature option with a stable API and extensive documentation. It scales well with smart rendering and supports enterprise-grade features like auto-scheduling and resource charts. Commercial editions include professional support, while the free GPL version is limited in both licensing and support. Its default look and feel can appear dated compared to newer competitors.
At a glance:
- Best sides: advanced scheduling, resource management, proven scalability, reliable documentation, enterprise support in PRO.
- Trade-offs: GPL restrictions for free edition, limited support without PRO, dated default styling.
Best Use Cases
Best for enterprise and commercial apps that require built-in auto-scheduling and critical path analysis.
Highcharts Gantt
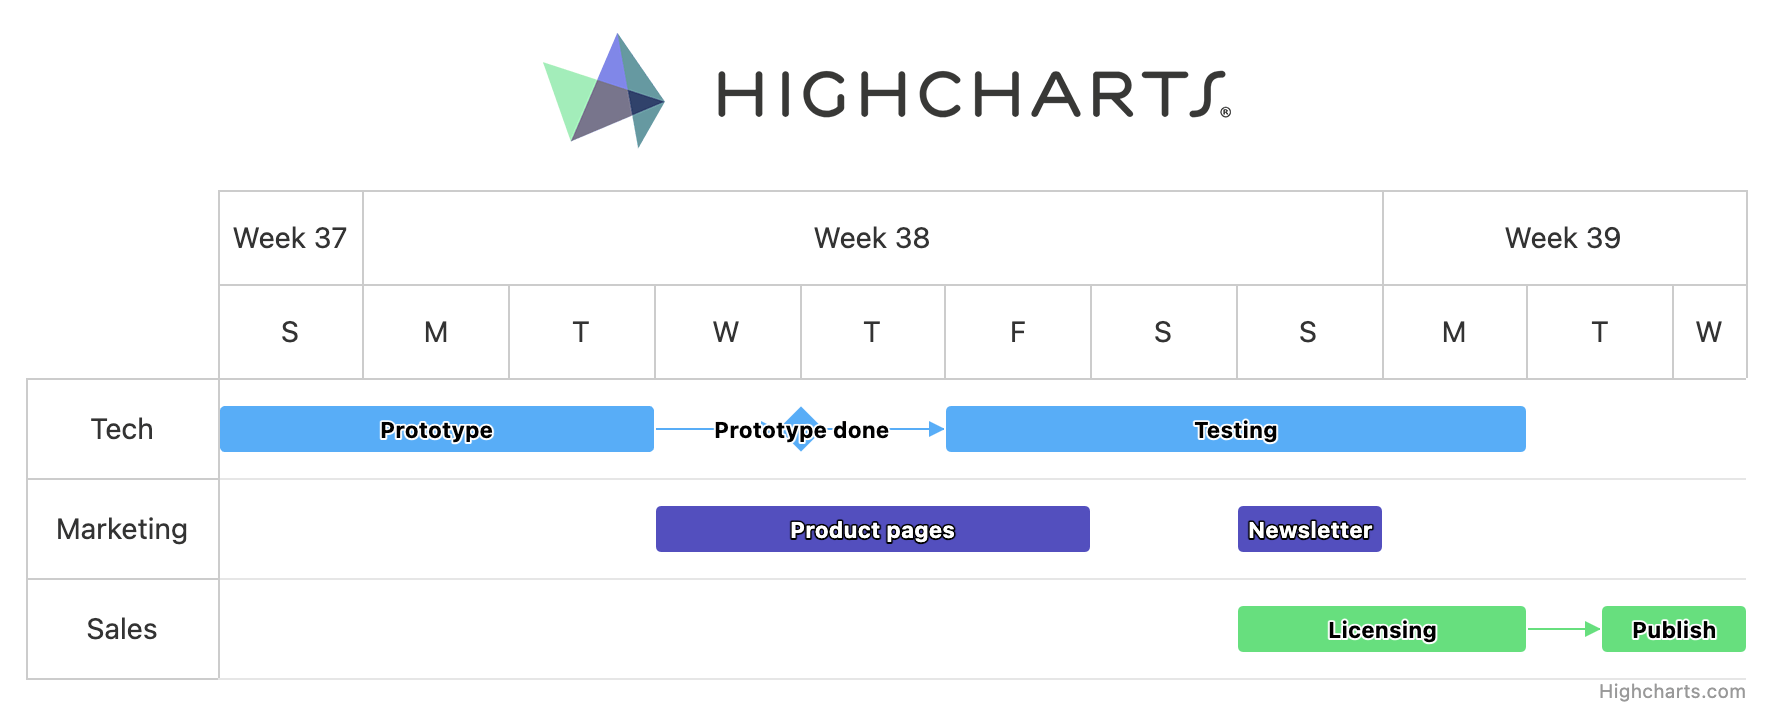
Highcharts JavaScript Gantt Chart
Highcharts Gantt is a dedicated JavaScript Gantt module built on the Highcharts engine. It brings the familiar Highcharts API and polished visuals to project timelines.
Its features include dependencies, milestones, baselines, percent-complete indicators, and today markers. Users can drag tasks to adjust dates and durations, while built-in exporting supports PNG, PDF, SVG, and Excel. For interactivity, the defaults are simple but effective, focusing on clarity and visual polish.
Key Features
- Dependencies, milestones, and percent complete
- Drag-and-drop task updates
- Export to PNG, PDF, SVG, and Excel
- Attractive default themes
Integration
Highcharts Gantt integrates smoothly with React, Angular, and Vue, supported by official wrappers. It is also TypeScript-friendly, making it accessible in modern front-end stacks. Teams already using Highcharts benefit from unified styling and APIs across multiple chart types.
Licensing
Highcharts offers commercial licenses for internal projects, SaaS products, and OEM distribution. Personal, educational, and non-profit use is free under specific licenses.
Strengths and Limitations
Highcharts Gantt is valued for its polished design and strong ecosystem. It has good documentation and an active charting community. Commercial support is available for licensed users. Still, it lacks advanced project management features and may struggle with very large datasets compared to specialized engines.
At a glance:
- Best sides: attractive defaults, strong docs, active community, consistent ecosystem, commercial support.
- Trade-offs: limited PM logic, performance limits at very large scale.
Best Use Cases
Best for dashboards and reporting tools when polished visuals and consistency within an existing Highcharts ecosystem are key.
Syncfusion Gantt (Essential JS 2)
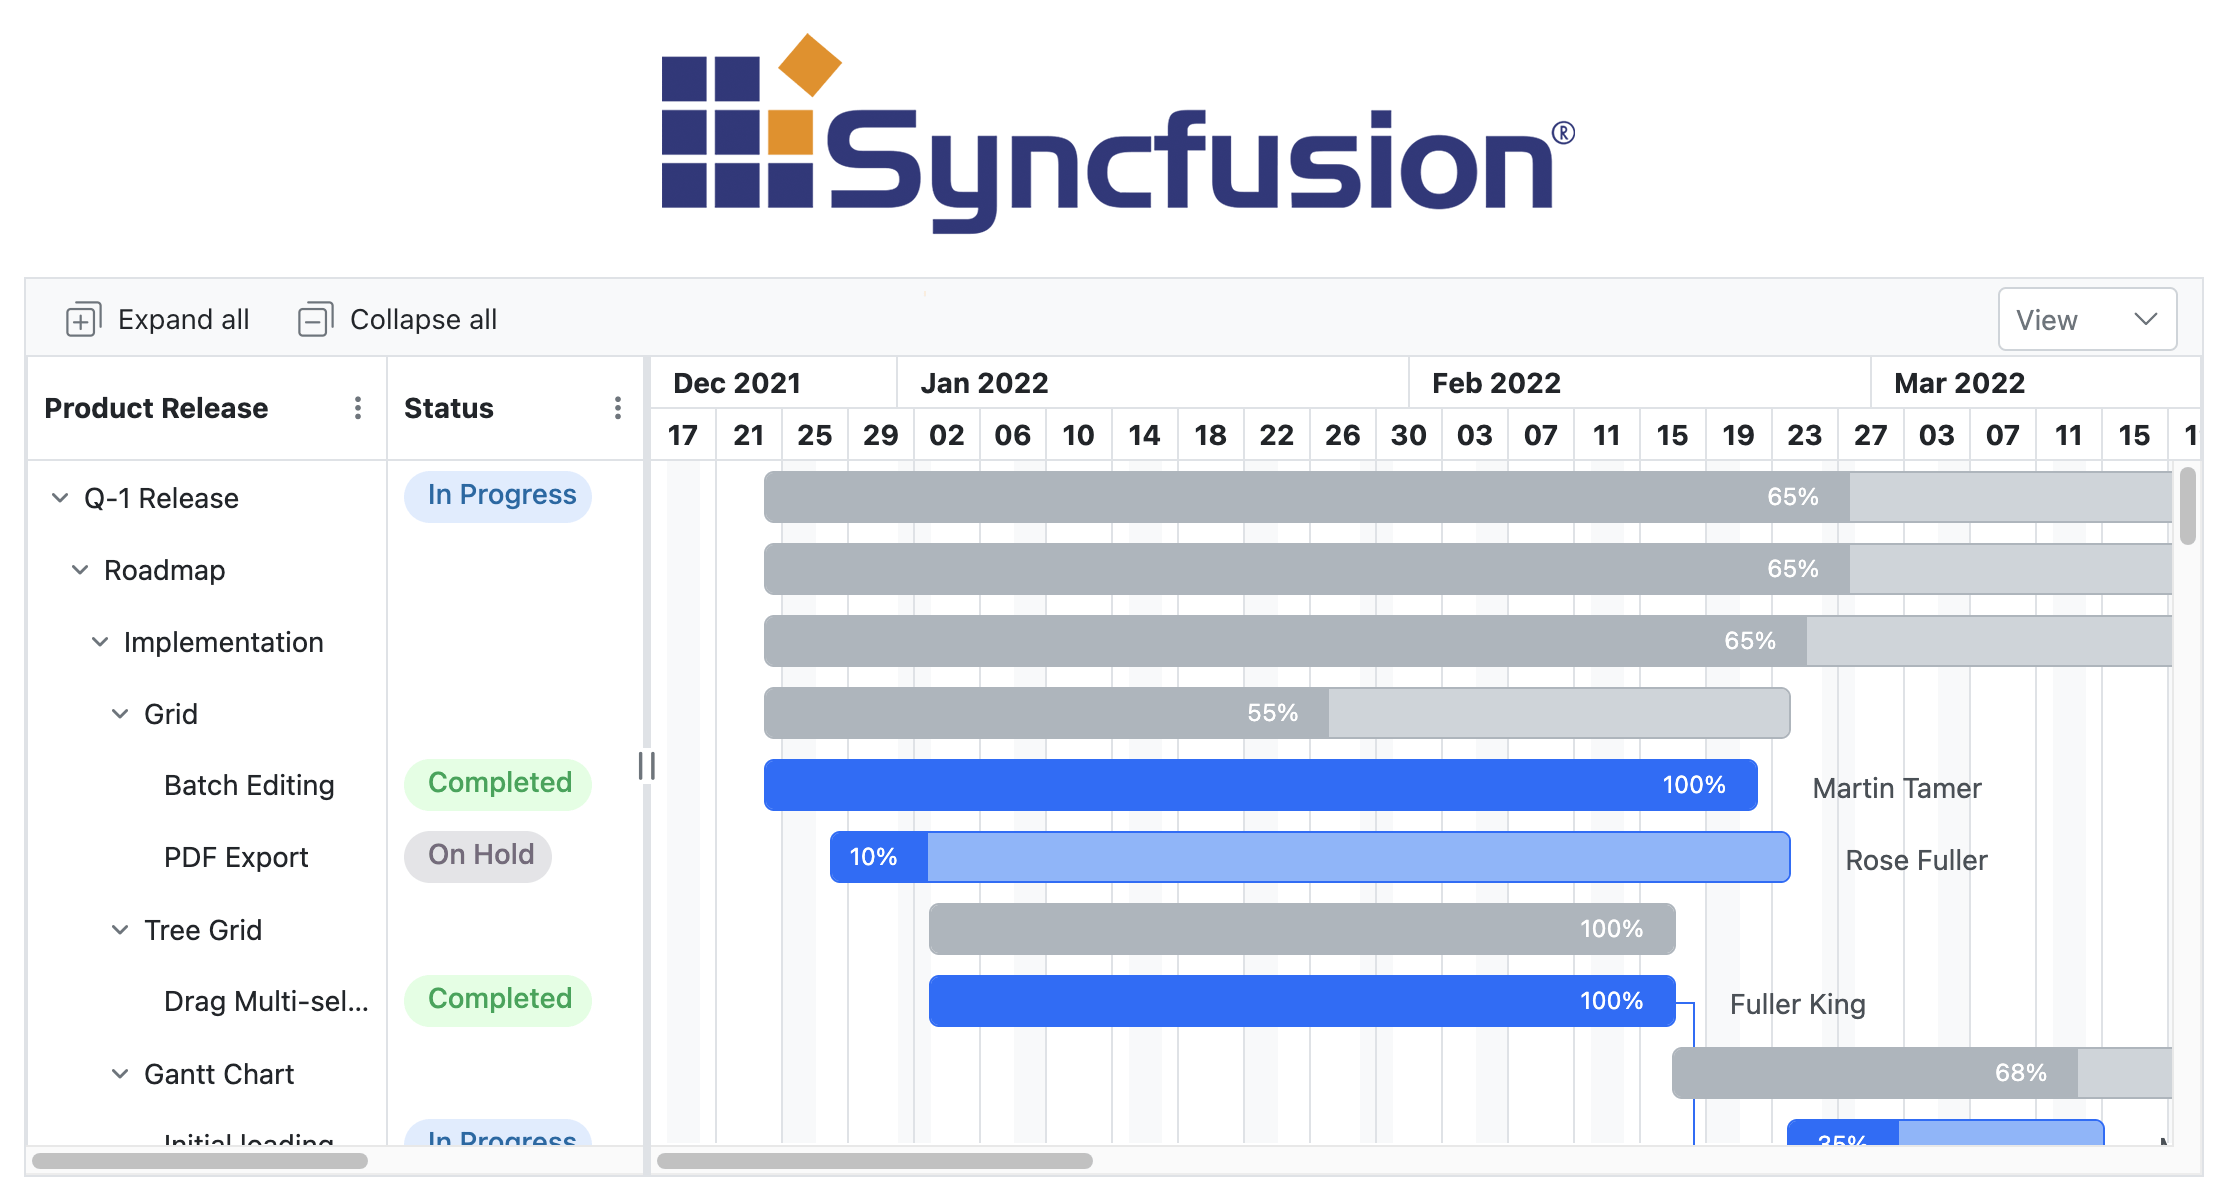
Syncfusion JavaScript Gantt Chart
The Syncfusion Gantt component is part of Essential JS 2 (EJ2), a large UI component suite. It combines project management features with tight framework integrations.
Functionality includes auto- and manual scheduling, dependencies, baselines, critical path analysis, and resource views. It also provides built-in dialogs for editing tasks and links. For large projects, virtual scrolling keeps both grid and timeline responsive. Accessibility, globalization, and theming support make it enterprise-ready.
Key Features
- Auto- and manual scheduling
- Critical path and baselines
- Resource views and editing dialogs
- Virtual scrolling for large datasets
Integration
Syncfusion offers strong support for React, Angular, and Vue, with first-class wrappers. Being part of EJ2, the Gantt shares patterns and styling with more than 100 other components, giving teams consistency across an entire UI stack.
Licensing
Syncfusion uses a subscription licensing model. The Community License is free for individual developers and small companies (less than $1M in revenue and 5 developers/10 employees). Paid subscriptions include enterprise support and updates.
Strengths and Limitations
Syncfusion Gantt benefits from comprehensive documentation, robust framework integrations, and enterprise-grade support as part of the EJ2 suite. Its footprint is heavy, which makes sense for teams already using Syncfusion but may feel like overkill if only Gantt is needed. The subscription-only licensing model may not suit organizations that prefer perpetual licensing for long-term cost control or compliance reasons.
At a glance:
- Best sides: deep framework integration, extensive documentation, enterprise support, rich feature set.
- Trade-offs: heavy when only Gantt is required, no perpetual license, suite complexity adds onboarding overhead.
Best Use Cases
Best for organizations standardizing on Syncfusion’s UI suite, where deep framework integration and enterprise-grade support across components are priorities.
Frappe Gantt
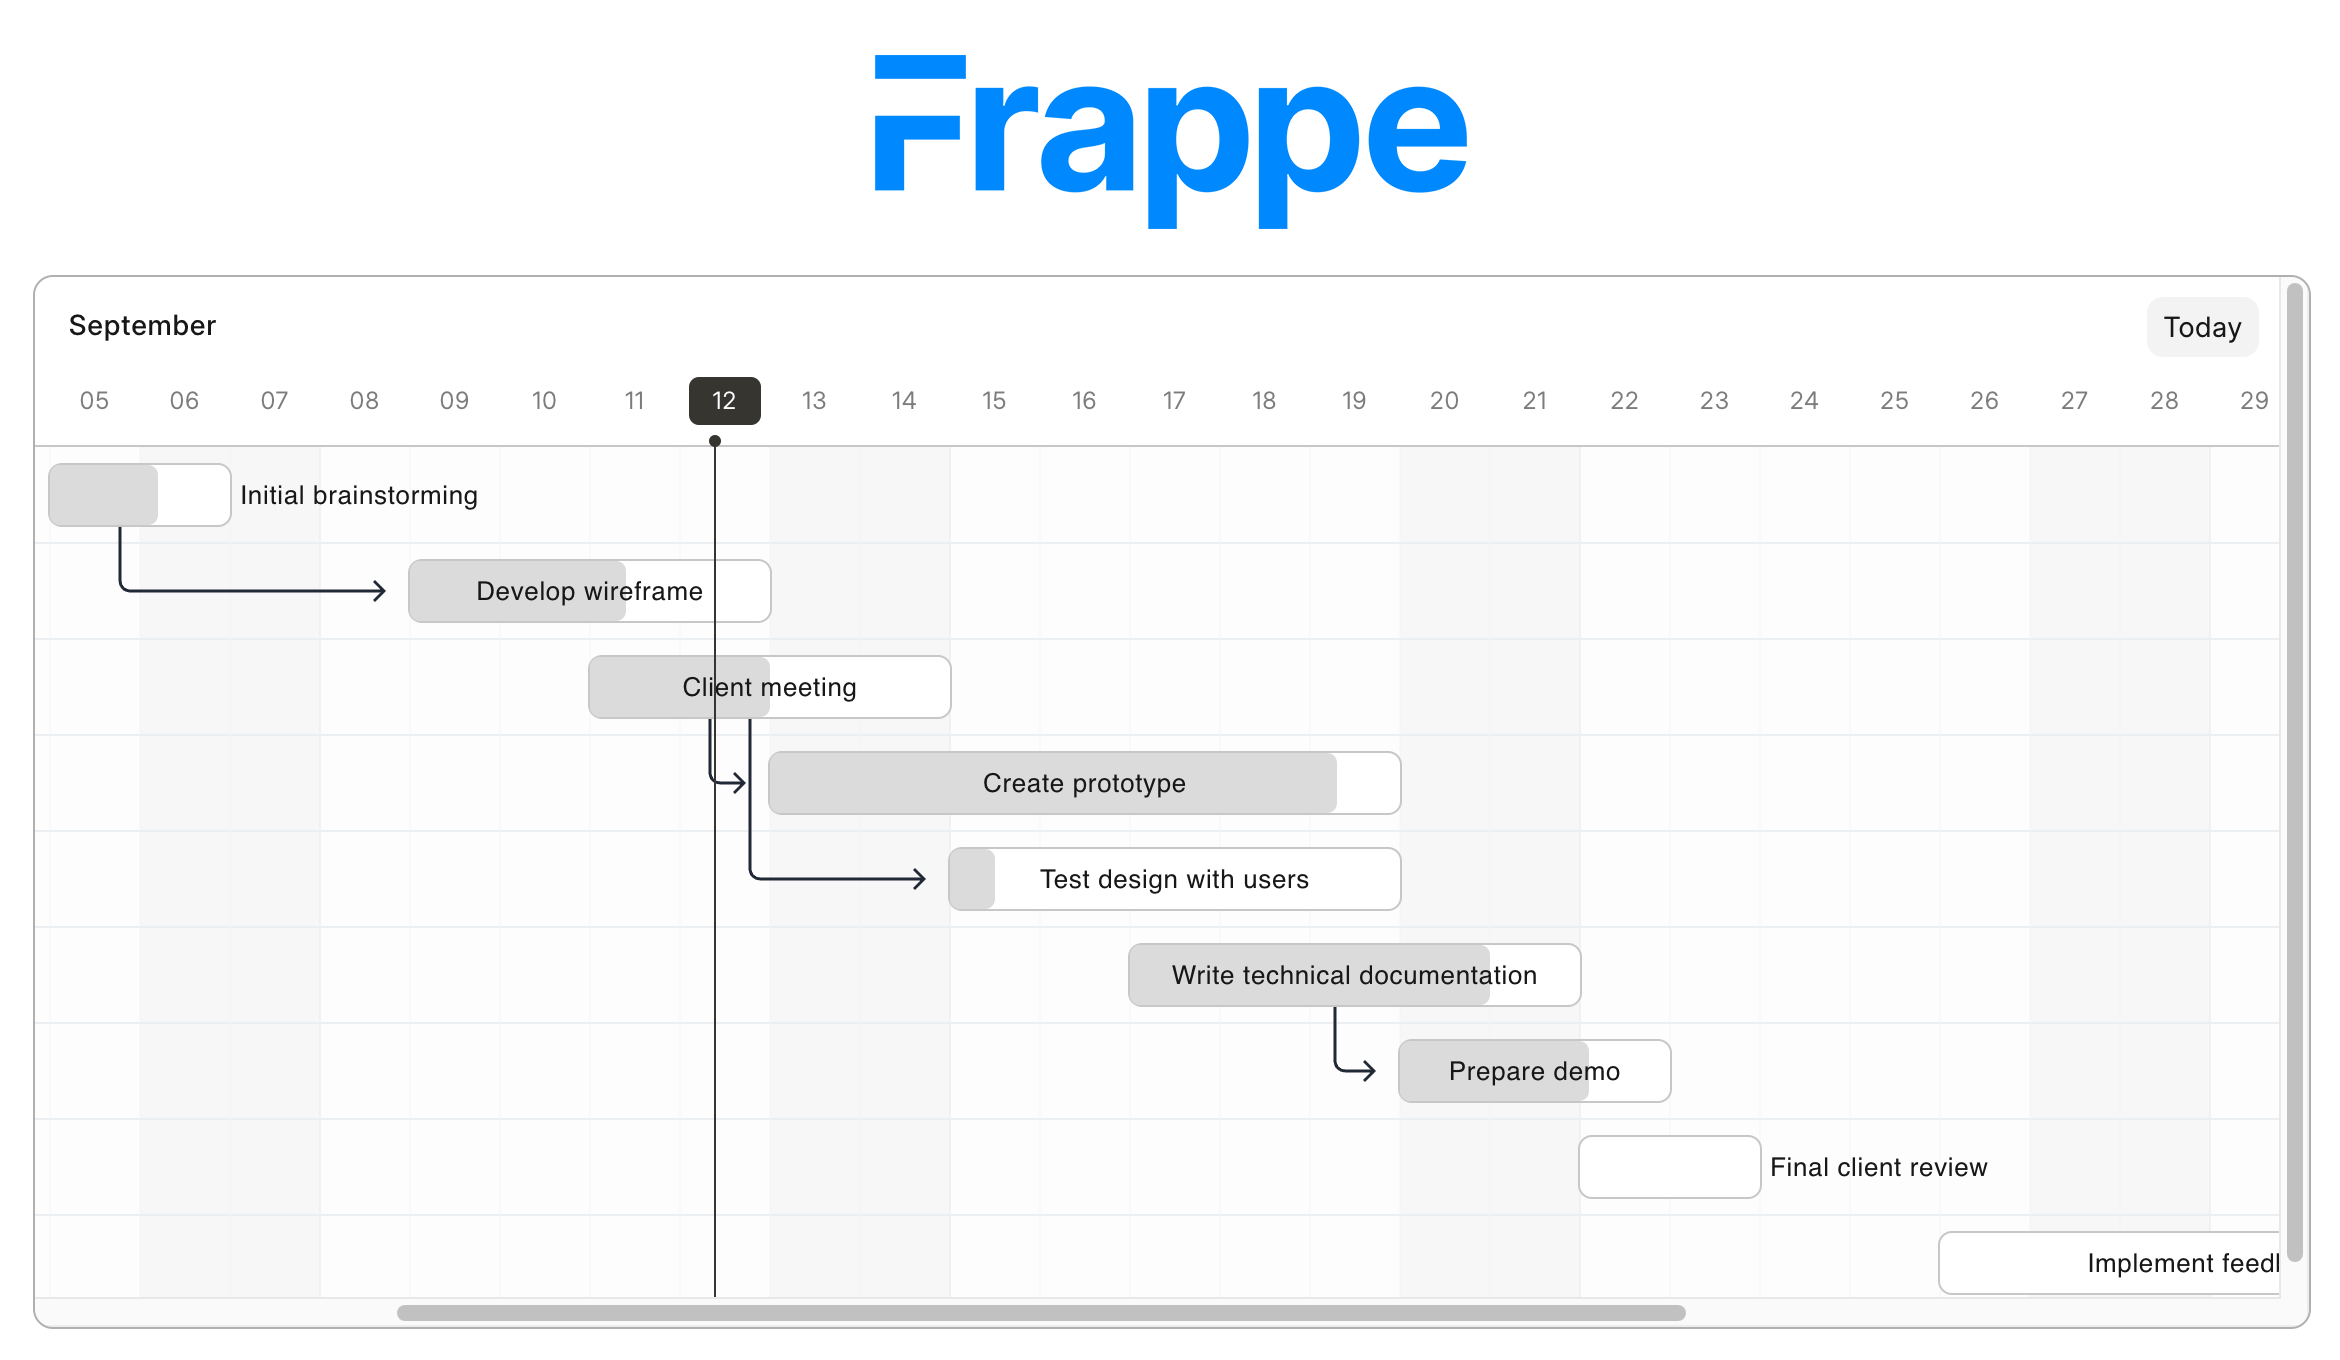
Frappe JavaScript Gantt Chart
Frappe Gantt is a lightweight, open-source JavaScript Gantt library that emphasizes simplicity and ease of use. It is designed for straightforward timelines rather than enterprise-scale scheduling.
Features include basic task and milestone visualization, simple dependencies, and drag-and-drop adjustments. Multiple zoom levels (day, week, month, quarter) help with readability. Its footprint is small, and styling can be customized via CSS.
Key Features
- Simple tasks and milestones
- Basic dependencies
- Drag-and-drop adjustment
- Multiple zoom levels
Integration
Frappe Gantt is framework-agnostic and published on npm. It works with any front-end stack and has community wrappers for React, Angular, and Vue. Its lightweight nature makes it easy to embed into internal tools or prototypes.
Licensing
The library is MIT-licensed and free for both personal and commercial use. This eliminates licensing friction entirely.
Strengths and Limitations
Frappe Gantt is minimal and fast to set up, licensed under MIT for maximum flexibility. Its simplicity makes it effective for prototypes and small projects. Documentation is limited to a README and a few examples, and support is restricted to GitHub issues and community contributions. It lacks enterprise features and does not scale for very large datasets.
At a glance:
- Best sides: very lightweight, easy to use, MIT license.
- Trade-offs: minimal documentation, no formal support, lacks enterprise functionality.
Best Use Cases
Best for prototypes, internal tools, and small projects where lightweight setup, simple features, and open-source licensing are most important.
How to Create JS Gantt Chart
Building a Gantt chart in a web application is straightforward with a good JavaScript library. Most modern libraries provide APIs for defining tasks, setting start and end dates, and establishing dependencies. To illustrate the basics, here is a simple example creating a project Gantt chart using AnyChart (AnyGantt).
First, prepare the HTML part: load the required library scripts and add a container element.
<!doctype html>
<html lang="en">
<head>
  <title>JavaScript Gantt Chart</title>
  <script src="https://cdn.anychart.com/releases/8.13.1/js/anychart-core.min.js"></script>
  <script src="https://cdn.anychart.com/releases/8.13.1/js/anychart-gantt.min.js"></script>
</head>
<body>
  <div id="container" style="width: 100%; height: 100%;"></div>
  <script>
    <!-- The entire JavaScript Gantt charting code goes here -->
  </script>
</body>
</html>
Second, add tasks data using the tree data model. In this case, data is added as a tree but can also be added as a table. You can load data from a file or add it directly to the code.
var data = [{
  id: "1",
  name: "Application Development Project",
  actualStart: Date.UTC(2025, 01, 02),
  actualEnd: Date.UTC(2025, 06, 15),
  children: [{
    id: "1_1",
    name: "Planning",
    actualStart: Date.UTC(2025, 01, 02),
    actualEnd: Date.UTC(2025, 01, 22),
    connectTo: "1_2",
    connectorType: "finish-start",
    progressValue: "75%"
  },
  {
    id: "1_2",
    name: "Design and Prototyping",
    actualStart: Date.UTC(2025, 01, 23),
    actualEnd: Date.UTC(2025, 02, 20),
    connectTo: "1_4",
    connectorType: "finish-start",
    progressValue: "60%"
  },
  {
    id: "1_3",
    name: "Evaluation Meeting",
    actualStart: Date.UTC(2025, 02, 23),
    actualEnd: Date.UTC(2025, 02, 23)
  },
  {
    id: "1_4",
    name: "Development",
    actualStart: Date.UTC(2025, 02, 26),
    actualEnd: Date.UTC(2025, 04, 26),
    connectTo: "1_5",
    connectorType: "finish-start",
    progressValue: "90%"
  },
  {
    id: "1_5",
    name: "Testing",
    actualStart: Date.UTC(2025, 04, 29),
    actualEnd: Date.UTC(2025, 05, 15),
    connectTo: "1_6",
    connectorType: "finish-start",
    progressValue: "60%"
  },
  {
    id: "1_6",
    name: "Deployment",
    actualStart: Date.UTC(2025, 05, 20),
    actualEnd: Date.UTC(2025, 05, 27),
    connectTo: "1_7",
    connectorType: "finish-start",
    progressValue: "100%"
  },
  {
    id: "1_7",
    name: "Maintenance",
    actualStart: Date.UTC(2025, 05, 30),
    actualEnd: Date.UTC(2025, 06, 11),
    progressValue: "40%"
  }]
}];
Third, initialize a project Gantt chart and feed the data:
var dataTree = anychart.data.tree(data, "as-tree");
var chart = anychart.ganttProject();
chart.data(dataTree);
Fourth, specify the container and render the resulting Gantt chart:
chart.container("container");
chart.draw();
Finally, make sure all things JavaScript are wrapped within the anychart.onDocumentReady() function within the <script> tag, and here is the full JS Gantt code assembled together:
<script>
  anychart.onDocumentReady(function () {
    var data = [{
      // tasks
    }];
    var dataTree = anychart.data.tree(data, "as-tree");
    var chart = anychart.ganttProject();
    chart.data(dataTree);
    chart.container("container");
    chart.draw();
  });
</script>
Look at the result:
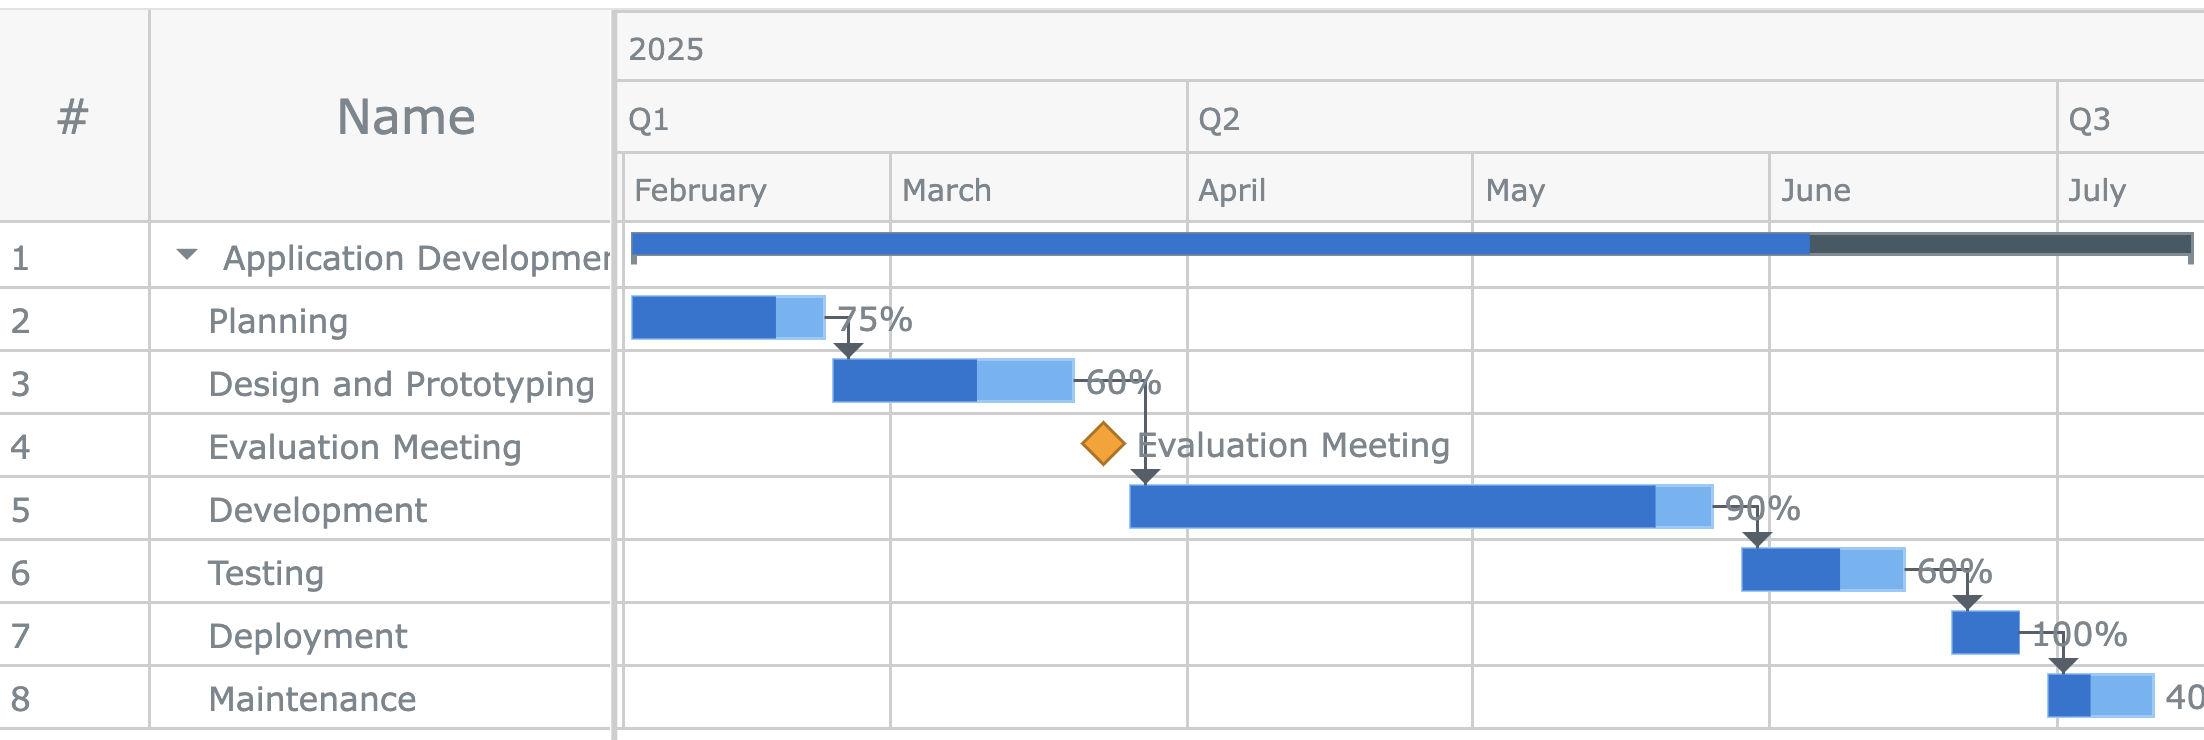
Result — Basic JavaScript Gantt Chart Example
This minimal example shows how quickly you can add an interactive Gantt chart to a webpage. From here, you can expand the chart with milestones, baselines, and fully customized styling depending on your project needs.
Check out the live interactive Gantt chart with full source code to experiment further.
Recommendations by Scenario
When choosing a JavaScript Gantt chart library, the “right” option depends on the type of project, the environment it will run in, and the depth of scheduling functionality required.
- Flexible dashboards, reporting platforms, SaaS products, and BI apps:
AnyChart (AnyGantt) — feature-rich, export-friendly, integration-agnostic, with licensing options for everything from startups to enterprises.
- Enterprise-grade scheduling systems (ERP, PM, CRM):
Bryntum or DHTMLX — built-in scheduling engines with auto-scheduling, constraints, and critical path analysis.
- Teams already invested in the Highcharts ecosystem:
Highcharts Gantt — leverages the same API and polished visuals, making adoption seamless.
- Organizations standardized on Syncfusion:
Syncfusion Gantt — works best when the full EJ2 suite is already part of the stack.
- Lightweight prototypes, internal tools, and small projects:
Frappe Gantt — minimal setup, MIT-licensed, good for quick timelines.
Gantt Chart Use Cases by Industry
Different industries can use Gantt charts in different ways, and the data visualization library choice depends on context:
- IT & Software Development:
Sprint planning, product roadmaps, release management.
- Construction & Engineering:
Task sequencing, resource allocation, milestone tracking.
- Manufacturing & Logistics:
Production schedules, supply chain dependencies, capacity planning.
- Finance & Consulting:
Client projects, reporting dashboards, high-level portfolio timelines.
- Education & Research:
Academic projects, grant tracking, collaborative research schedules.
- Startups & Small Businesses:
Lightweight planning tools, MVP features, SaaS dashboards.
Final Thoughts
JavaScript Gantt chart libraries in 2025–2026 range from lightweight open-source tools to enterprise-ready solutions with advanced data visualization and analytics capabilities. There is no single best option for every project — the right choice depends on your goals, scale, technology stack, and budget.
Experiment with the JS libraries that match your requirements and see which one works best in your workflow. Whether you are building an internal tool, a SaaS application, or a large-scale enterprise system, the right Gantt solution will help make timelines clearer and project management more effective.
Happy Gantting with JavaScript!
- Categories: AnyChart Charting Component, AnyGantt, Big Data, Business Intelligence, Dashboards, Gantt Chart, HTML5, JavaScript, Tips and Tricks
- No Comments »