 The world’s leader in data visualization, AnyChart has a proven track record of empowering enterprises with robust charting solutions. However, the true essence of AnyChart lies in its versatility — it extends beyond corporate analytics, to making data meaningful in our everyday lives.
For example, meet William Dibbern, an Engineering Manager based in Chicago, who ingeniously applied our JavaScript charting library to his upcoming wedding plans, turning them into a heartfelt blend of technology and emotion.
Join us for an insightful interview with Will as we delve into his journey, exploring how he harnessed the power of AnyChart JS Charts to craft a delightful experience that celebrates love and data in a refreshingly personal way.
AnyChart: Hi Will! To kick things off, could you tell us a bit about yourself and your background?
William Dibbern: Hi there! My name is Will, and I live in Chicago. By day, I’m an Engineering Manager, and when I’m not working, I’m frequently tinkering with various personal projects or running.
A: It’s always interesting to hear the story behind a project. How did the idea for creating this website come about, and what’s the main purpose driving it?
WD: The idea for this project came about because my fiancé and I are getting married later this year! As someone who has a background in web development, it was only natural that as we started working through vendor selections, I selected myself to handle our wedding website.
We explored a bunch of different wedding websites and design inspirations a month or so after our engagement and arrived at a rough outline of what we’d like the site to include. We knew it was going to be a while between sending our save-the-dates and our invites, so we decided that earmarking space for the RSVP page to eventually exist was important to us.
A: Very cool! So, what’s the idea behind using data visualization on your website?
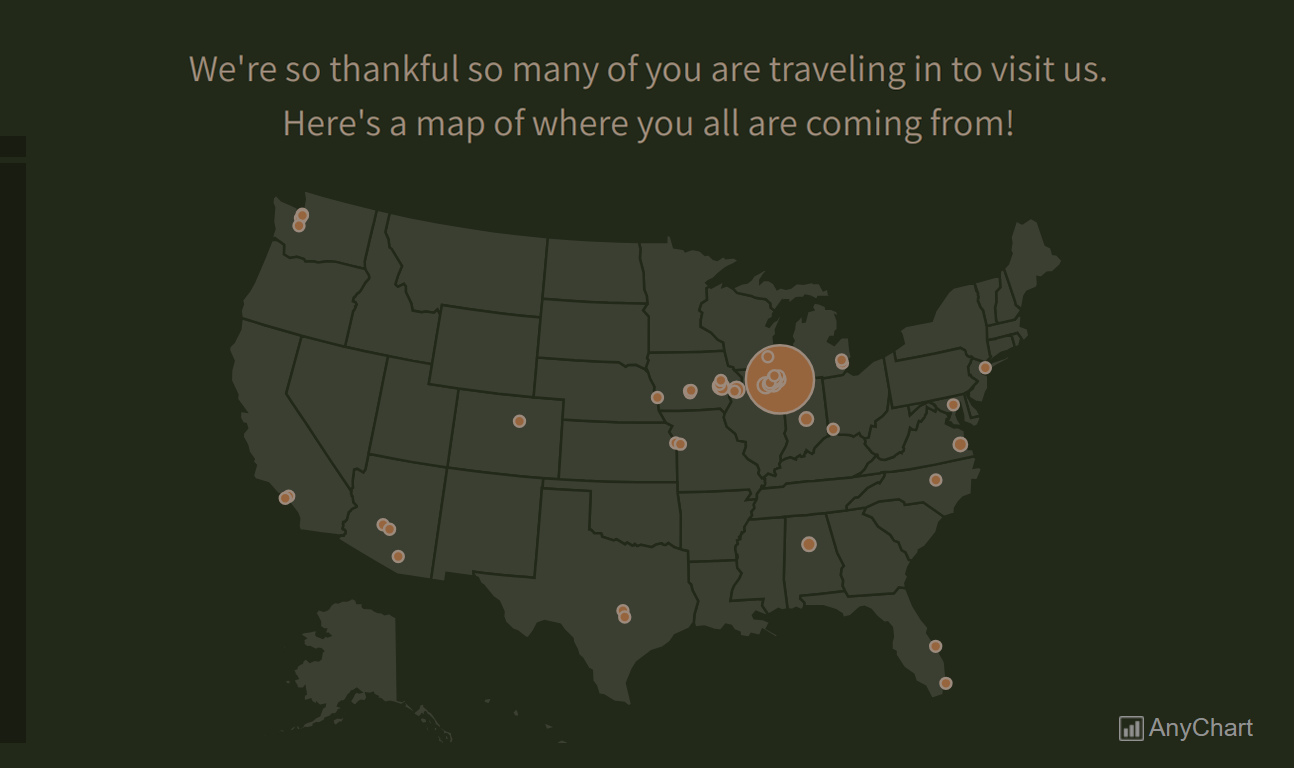
WD: As we brainstormed more and thought about everyone that would be attending our wedding, we started to think it would be fun to see exactly how spread out our guests are across the country. And that’s how we got to implementing a data visualization using AnyChart!
A: Can you elaborate on the specific data and chart style you used?
WD: We decided the best way to represent our data was going to be a bubble chart over the country, i.e., a bubble map. We wanted to showcase Chicago as our home and where our life is centered, and our invites from the Chicagoland area correlated to that idea. We also noticed that as we were getting the dates ready, there were friends and relatives each of us knew that didn’t know each other but lived in the same area. Seeing those people grouped together was a fun kind of symmetry between our eventual marriage, and our friends and families getting to meet for the first time.
A: AnyChart caught your eye — how did you stumble upon our JavaScript charting library, and what specific feature stood out to you?
WD: I used to work in a space where we did a lot of custom dashboards, for a lot of third parties. We evaluated a lot of different options, and AnyChart was one of them. I liked the breadth of offerings, depth of documentation, and ease of implementation with vanilla JavaScript. They were super easy to proof of concept, and didn’t take much effort to productionize them after that, regardless of which frontend framework we were wiring it up to.
A: Let’s dive into the technical details. Could you share more about the technology stack that powers your project?
WD: The highlights of the tech stack I chose for this include: React, Styled Components, Flagsmith, Firebase, and of course AnyChart. Getting an app started with React and Firebase is so simple. This stack allows me to spend more of my time tinkering with the frontend, where I prefer to, rather than the backend. I have a full stack background; the frontend is simply more of a passion for me.
A: Integrating tools into projects can be an adventure. How was your experience of bringing AnyChart into your tech stack? Were there any hurdles or stand-out moments during this process?
WD: Integrating AnyChart was so very smooth! Mimicking my experiences in a professional environment, I spent most of my time getting the data together, and barely any time in the AnyChart docs because they are so straightforward.
The main challenge I encountered was geocoding the addresses of all of our guests. I ended up finding a free service online to handle this and storing the results in a flat file, given that the data set is static and relatively tiny. It was certainly a lot of manual data munging, but it was so rewarding to see the final map chart at the end!
A: Looking at the bigger picture, in which aspects do you think AnyChart could be enhanced? Any thoughts on possible improvements for future versions?
WD: I wish that the React integration was a little easier. That said, the documentation for the charts in vanilla JavaScript was so easy to use that most of my time was actually spent geocoding our guest list so that they’d be mapped appropriately. It only took an hour or two to get the graphic itself up and running.
A: Imagine a friend seeking advice on data visualization libraries, would you recommend AnyChart?
WD: Oh, most definitely! The breadth of options, depth of documentation and examples, and support I received throughout the process were heartwarming. As an Engineering Manager who has worked with a fair number of vendors over the years, this was definitely one of the best experiences I’ve had.
A: Thanks for choosing AnyChart and sharing your insights! We extend our warmest wishes for your wedding and wish you and your fiancé a sweet celebration and a lifetime of joy together in marriage!
Want to share your AnyChart story? Feel free to reach out to us!
See more customer stories on our blog.
- Categories: AnyChart Charting Component, AnyMap, Charts and Art, HTML5, JavaScript, Success Stories, Third-Party Developers
- No Comments »