 Data visualization is a game-changer when it comes to exploring and making sense of data. And here at AnyChart, we’re passionate about making the development of interactive charts a breeze. Our award-winning JavaScript charting library is not only trusted by the big players in enterprise data intelligence systems, with over 75% of Fortune 500 companies relying on it. It is a go-to choice for thousands of developers worldwide who want to easily create awesome visualizations for their – and their clients’ – websites and apps.
Recently, we discovered a stunning sunburst chart powered by AnyChart on the website of the Berlin University Alliance. This diagram effectively organizes the ideas submitted by Berliners within the framework of the #Berlinforschtmit project, which calls upon the local community to tip scientists regarding new research topics. These collective efforts aim to make significant contributions toward enhancing the quality of life in the city.
We’ve had the pleasure of having a quick conversation with Björn Knetter from Freiheit Gruppe, the team responsible for the design and technical implementation of #Berlinforschtmit. He told us more about this innovative initiative and how they leverage AnyChart for impactful data visualization. All aboard for our quick interview!
AnyChart: Can you please introduce yourself to our community?
Björn Knetter: I’m Björn Knetter, representing Freiheit Gruppe, a digital media consulting and development agency based in Frankfurt, Germany. At Freiheit Gruppe, we pride ourselves on our ability to adapt to our customers’ needs. Working with clients from various sectors and of all sizes, we focus on understanding our customers’ goals and delivering optimal solutions prioritizing usability.
A: You have recently used our JavaScript charting library in #Berlinforschtmit – could you tell us about this project?
BK: The #Berlinforschtmit (“Research for Berlin”) project, led by the Berlin University Alliance, aims to connect scientists with the people of Berlin. It invites residents to suggest questions, topics, and ideas for new research that can contribute to improving life in the city and its neighborhoods. Our team had the privilege of handling the design and technical implementation of this project.
Berliners have the flexibility to submit their questions digitally, either through voice or text messages or by using a pen and postcard at various events held in the city. The submissions undergo a thorough review and are then uploaded online, making them accessible to everyone.
A: Why is data visualization needed in this project?
BK: With nearly 1000 questions, topics, and ideas collected so far, it is important to make this wealth of information accessible. Data visualization allows us to present the entire input in a concise and easily explorable manner, enabling anyone to understand the concerns and research interests of the people of Berlin.
A: How did you use AnyChart?
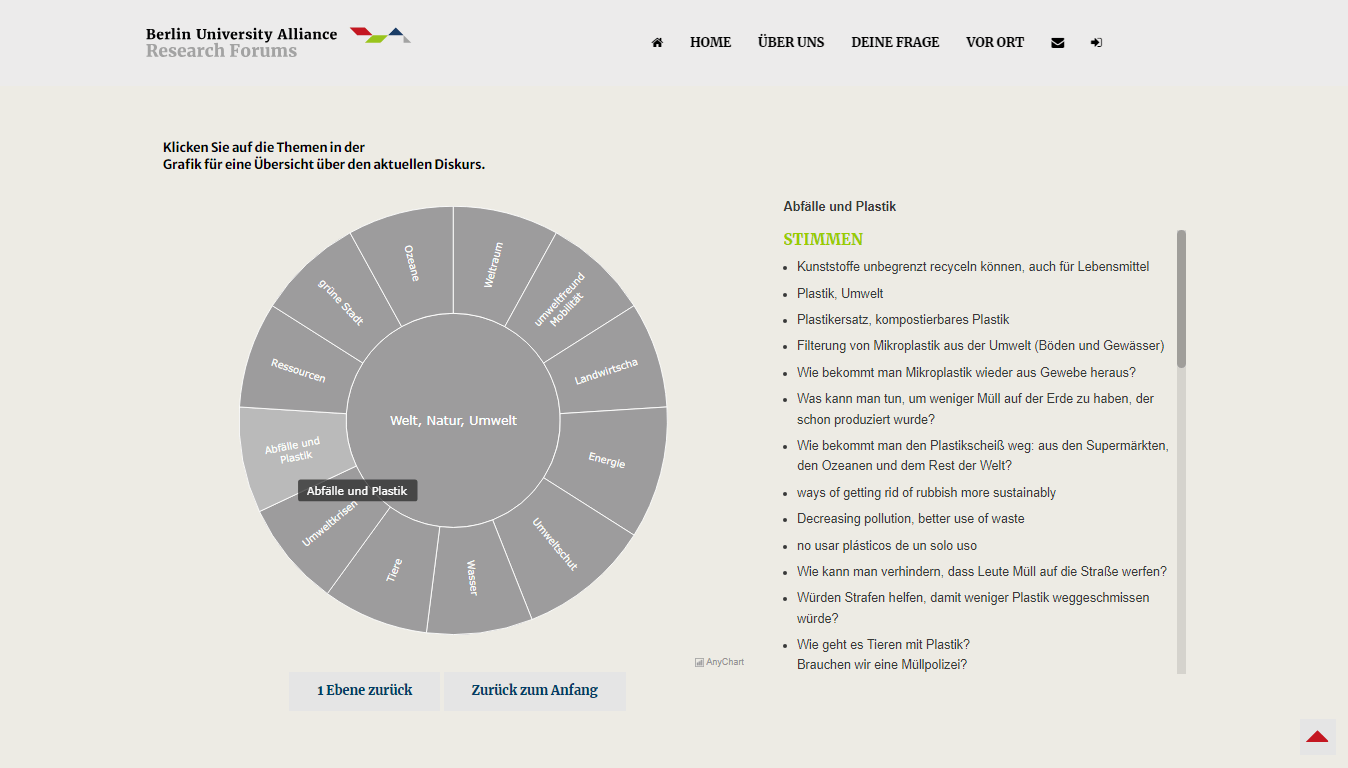
BK: We utilized the AnyChart JavaScript charting library to create an interactive sunburst chart for a visual summary of the suggestions.
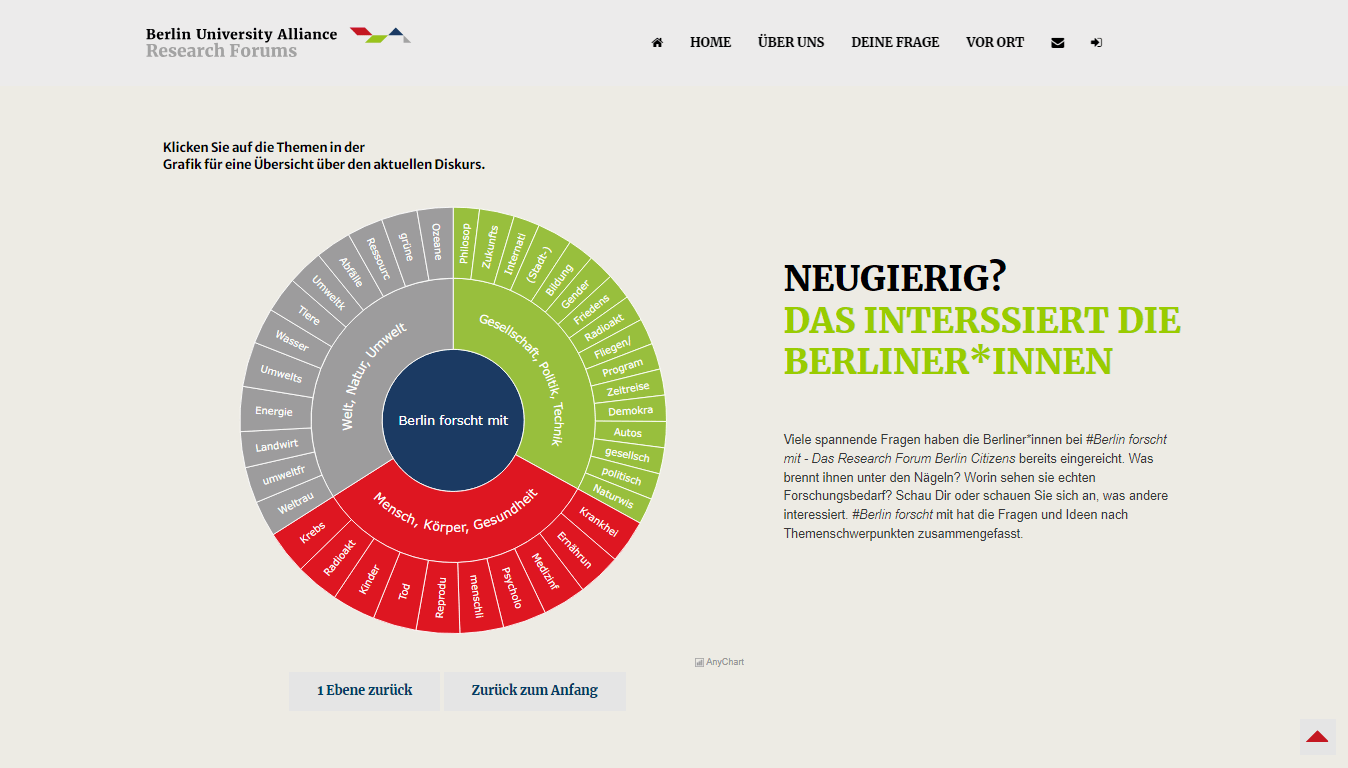
We organized the questions by topic, and users can click on a topic to see all the related ideas. The topics are grouped into three thematic areas: world, nature, and environment; humans, body, and health; and society, politics, and technology.
A: Can you provide some insight into the technology stack of the project?
BK: Our data is stored in MySQL/MariaDB and processed using PHP scripts. To facilitate collaboration among scientists, we created a backend for evaluation and communication, integrated with CMS Morpheus.
A: Was it easy to integrate AnyChart?
BK: Integrating AnyChart into our stack was a smooth process, and we did not encounter any significant challenges during the implementation phase.
A: What led you to choose AnyChart as your preferred charting solution?
BK: When selecting a charting solution, we had two primary criteria in mind: visual presentation and technical integration. AnyChart stood out for us in both aspects. The extensive collection of ready-to-use chart examples and the ability to easily add data using JavaScript made it a perfect fit. We appreciated how AnyChart took care of the visualization, allowing us to focus on the data.
A: Are there any areas where you think AnyChart could be further improved?
BK: Overall, we are satisfied with AnyChart. Additional graphic manipulation options out of the box would always be a welcome addition to further enhance the flexibility of the library while maintaining its simplicity.
A: Would you recommend using AnyChart for those seeking a robust data visualization library?
BK: I can recommend AnyChart without exception. It offers all conceivable visualizations and is easy to use.
A: Thanks! Best wishes to you and your team!
Would you like to share your AnyChart story? Feel free to reach out to us!
See more customer stories on our blog.
- Categories: AnyChart Charting Component, Big Data, HTML5, JavaScript, Success Stories
- No Comments »