 As the world’s top provider of cutting-edge data visualization solutions, we are constantly thrilled to witness how our products are utilized by both businesses and individuals to create interactive charts and dashboards. We recently had the opportunity to chat with software developer Nick Mar, who shared some of his personal projects with us, highlighting the use of AnyChart and his experience with our JavaScript charting library. Check out our interview with him! (Stack: HTML/CSS/JavaScript.)
AnyChart: To start with, could you please introduce yourself to our community?
Nick Mar: I am a software developer working for a healthcare company, but I’ve always loved coding in my free time. Sometimes, when I’m interested in a subject, I want to learn more, but I can’t find the tool or resource I need.
When this happens, I don’t just quit; I build a tool for myself. If it’s useful enough, I publish it as a website so the rest of the community can use it as a free resource. This is how I have found myself as the administrator of several small websites utilized by enthusiastic but relatively niche online communities.
A: In which projects are you using AnyChart JS Charts?
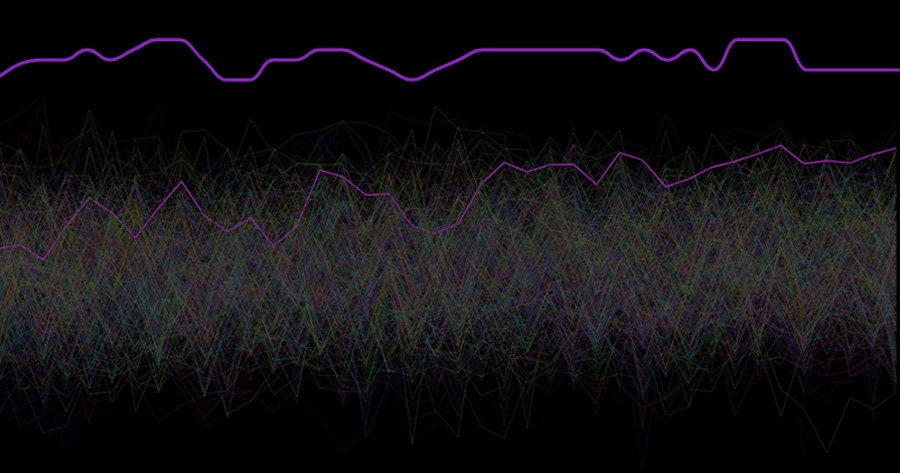
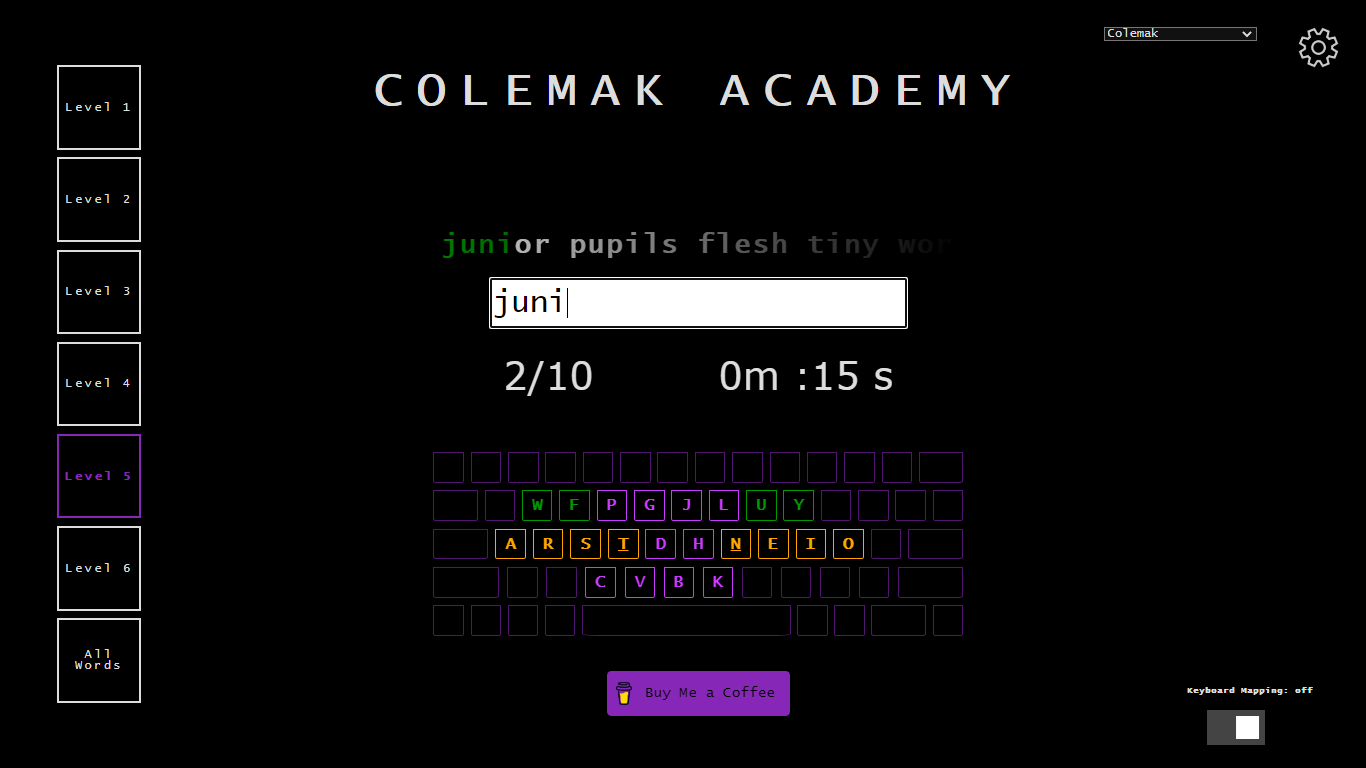
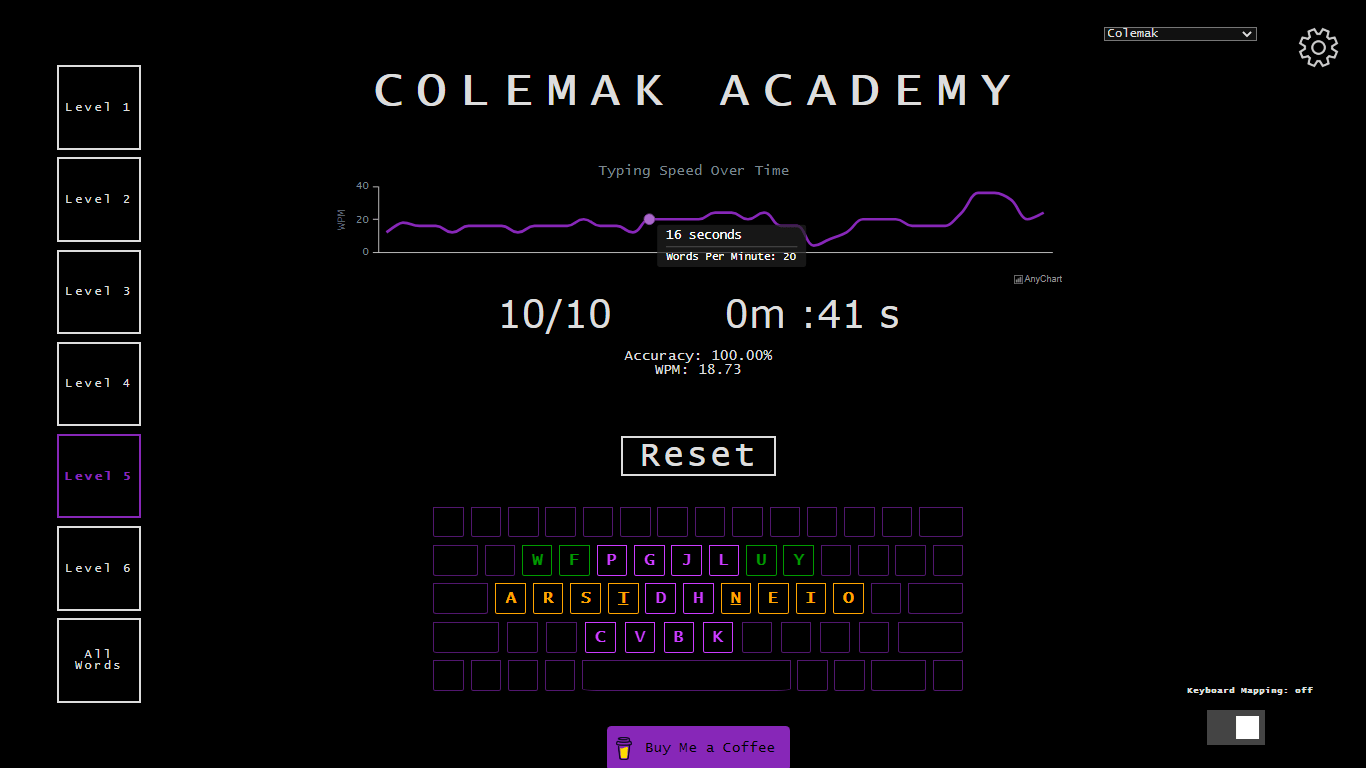
NM: I first used AnyChart for my typing tutor website, Colemak.academy. Although we are all familiar with a standard keyboard, it turns out there are many alternatives! According to some enthusiasts, there are arrangements of keys that are far superior to the one you’re used to. There are other layouts that emphasize wrist comfort, speed, and accessibility (typing for people who can only use one hand, for instance).
While there are already some learning tools out there, they focus on the most popular alternative layout, called Dvorak. Other, less well-known layouts, such as Colemak, suffer from a lack of educational resources. That’s why I created Colemak.academy; to provide a step-by-step tool for learning any keyboard layout, including completely novel custom ones.
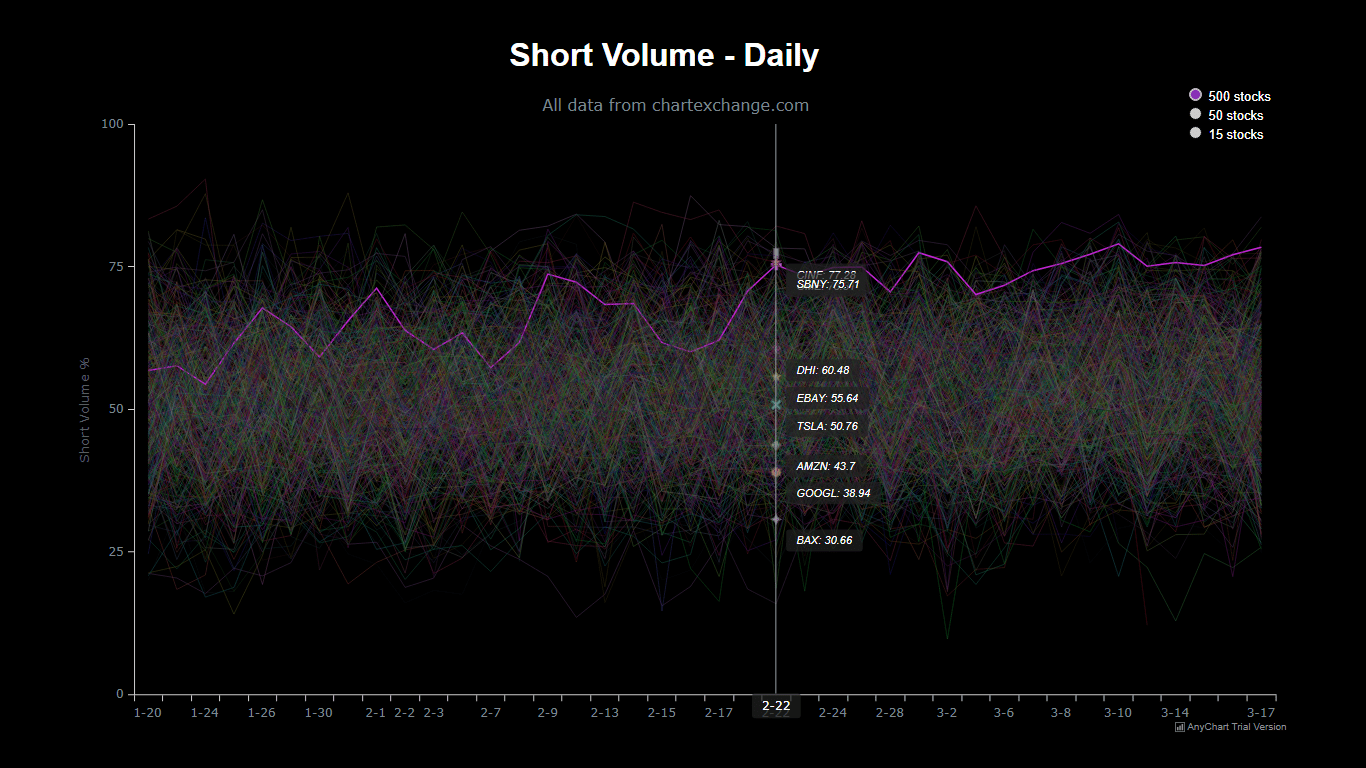
After using AnyChart for this project, I was inspired to create a data visualization tool for a memestock community that I had previously browsed. Memestocks took the world by storm in early 2021, with the media reporting on the war of Reddit vs the hedge funds. While most of this fervor has died away, there is still a dedicated and enthusiastic group of people pouring over the data for stocks like Gamestop. In particular, such enthusiasts are interested in the number of ‘shorts’, or bets against Gamestop by hedge funds. There is a lot of public financial information about shorts, but not all of it is compiled in a way that allows for comparison with other companies. This is why I created siGME.org, to track a specific metric, short volume percentage, of Gamestop compared to hundreds of other popular stocks.
A: What is the role of data visualization in these projects?
NM: For Colemak.academy, having a chart to visualize data is a huge value add. Allowing users to see feedback keeps them engaged and motivated to learn. AnyChart provides graphs of typing speeds over the course of a test so that users can see when they slowed down and when they sped up. This data, while technically not necessary to the learning experience, provides a huge aesthetic improvement and, more importantly, is a motivational keystone for learners on their journey to master a new keyboard layout.
On the other hand, charts are the core functionality and focal point of siGME.org. It is precisely the ability to visualize large amounts of data that makes this tool useful. The data exists already; there is simply no context for it. AnyChart allows me to provide that context with an easy comparison of GameStop to dozens, or even hundreds, of other companies.
A: How do you use AnyChart exactly?
NM: I use the AnyChart JavaScript charting library in multiple ways. In some cases, it adds aesthetic but nonetheless important features to a website in order to keep users engaged in learning. In others, I use it to create visualizations of stock data, such as line charts with hundreds of companies and tens of thousands of data points. The ability to easily customize this data and highlight certain stocks and trends among an ocean of information has allowed my website to come alive.
A: Please tell us some more about the technical side. What stack do you use for your projects?
NM: For my independent projects, I usually keep it simple. I use HTML, CSS, and JavaScript to construct my websites. I like to only use the most understandable plugins and libraries to enhance the user experience. With an easy-to-apply CDN and readable, modular code, AnyChart is a breeze to integrate into my current streamlined stack. In the future, I plan to use it to construct charts and graphs in a full-stack application, using information from a SQL database.
A: Was it easy to integrate AnyChart?
NM: It was pretty easy. Setting up a basic chart was an absolute breeze. There is good documentation for manipulating and customizing charts. The biggest challenge, if you can call it that, was formatting my data into a format that could be accepted by AnyChart. There were some other small hiccups that took some trial and error, like how to get tooltips to display the way I wanted with multiple lines of data, but a little fiddling was enough to get it working right. Overall, AnyChart was easier to use than almost any other library or plugin I’ve ever used for one of my projects.
A: Why did you choose our JavaScript charting library?
NM: I knew I needed a solution for visualizing data, and after a bit of googling and some simple examples of graphs from AnyChart, I decided to give it a try. If I had run into complications right away, I might have tried another solution, but AnyChart worked right the first time with my simple tests, so I knew I’d be able to get it right for my production applications.
A: What do you like the most about AnyChart?
NM: Well, working with the team has been great — enthusiastic, proactive, and friendly. For the tool itself, I like that I am able to keep almost all the logic in a single function. I also love that the graphs just look good, with very little tweaking. Add your own color scheme, and you’ve got customized, professional-looking visualizations.
A: What do you think it lacks?
NM: I plan on using AnyChart more in the future, so I’m sure I may come across some issues, but so far, it has worked correctly for basically everything I’ve needed. Thank you for the wonderful tool.
A: Would you recommend AnyChart to a friend looking for a JavaScript charting library?
NM: I’d absolutely give AnyChart a try. For basic applications, it’s a no-brainer. Easy to learn, easy to set up, and gives great charts and graphs. But I get the impression it’s not just for the basics. Need a line graph? Great, you’ve got your solution. Need something more complicated? A histogram with multiple data sources that also links to a fancy pie chart? I haven’t tried it, but I have no doubt these features exist and are easy to leverage.
A: Thank you for telling us about your projects and experience using AnyChart! Our team wishes you all the very best!
If you’d like to share your AnyChart story, please let us know.
See more customer stories on our blog.
- Categories: AnyChart Charting Component, HTML5, JavaScript, Success Stories
- No Comments »