 Humans are visual beings, and charts are widely used to boost the UX when it comes to showing a lot of information. Take Venn diagrams, for example, which are great at displaying commonalities and differences between several sets of items. And it’s possible to create a nice interactive one for a web page or app without much hassle.
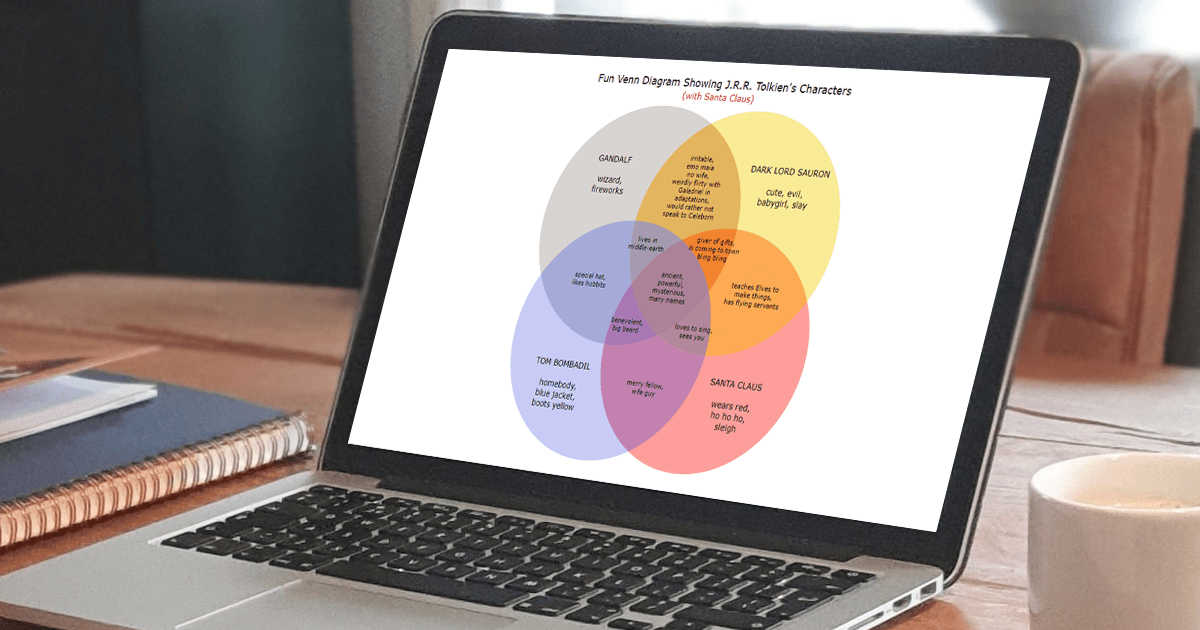
Scrolling through Twitter before Christmas, I came across a cool Venn diagram comparing Santa Claus, Sauron, Gandolf, and Tom Bombadil. For fun, I reproduced it using JavaScript. That appeared to be easy enough to give me an idea of a tutorial on how to quickly build JS-based Venn diagrams, which I hoped could be helpful to both designers and developers.
So, here I am with the article! The original graphic by Tea with Tolkien that inspired me is used as an illustrative example — let’s build this Venn diagram in JavaScript step by step right now!
Building JavaScript Venn Diagram
Creating a Venn diagram with JS is pretty straightforward. Generally speaking, there are four basic steps you should take. These are:
- Create an HTML container
- Include the JavaScript files to be used
- Add the data to be visualized
- Code the diagram
1. Create an HTML container
Create a basic HTML page or use an existing one. Add a <div> element as the container for your Venn diagram and give it a unique identifier. You can specify the size of the container to be 100% so that the chart fills the entire page, or adjust the style settings as you see fit.
Here is an example:
<!DOCTYPE html>
<html>
  <head>
    <title>JavaScript Venn Diagram</title>
  </head>
  <body>
    <div id=”container” style=”width: 100%; height: 100%”></div>
  </body>
</html>
2. Include the JavaScript files to be used
I will show you here how to use a JavaScript library to create a Venn diagram. JS charting libraries provide a basic setup to build data visualizations quickly with a minimum amount of code. There are some good ones out there that you can quickly find on Google. Here, I am using the AnyChart JS library.
To use any JavaScript charting library, you have to link the appropriate JS scripts necessary to create your data graphic. For a Venn diagram in this case, the “core” and “venn” modules are needed. These files are to be placed in the <script> tag of the <head> section of your HTML page.
<!DOCTYPE html>
<html>
  <head>
    <title>JavaScript Venn Diagram</title>
    <script src=”https://cdn.anychart.com/releases/8.11.0/js/anychart-core.min.js"></script>
    <script src=”https://cdn.anychart.com/releases/8.11.0/js/anychart-venn.min.js"></script>
  </head>
  <body>
    <div id=”container” style=”width: 100%; height: 100%”></div>
    <script>
      // All the JS Venn diagramming code comes here.
    </script>
  </body>
</html>
3. Add the data to be visualized
For this Venn diagram, the data is quite simple. So it can be added as a dataset organized as an array of objects. I took the data directly from the original visualization, and here is what I ended up with:
let data = [
  {
    x: "A",
    value: 100,
    name: "TOM BOMBADIL\n\nhomebody,\nblue jacket,\nboots yellow"
  },
  {
    x: "B",
    value: 100,
    name: "SANTA CLAUS\n\nwears red,\nho ho ho,\nsleigh"
  },
  {
    x: "C",
    value: 100,
    name: "GANDALF\n\nwizard,\nfireworks"
  },
  {
    x: "D",
    value: 100,
    name: "DARK LORD SAURON\n\n cute, evil,\nbabygirl, slay"
  },
  {
    x: ["A", "C"],
    value: 40,
    name: "special hat,\nlikes hobbits"
  },
  {
    x: ["A", "B"],
    value: 40,
    name: "merry fellow,\nwife guy"
  },
  {
    x: ["C", "D"],
    value: 40,
    name: "irritable,\nemo maia\nno wife,\nweirdly flirty with\nGaladriel in\nadaptations,\nwould rather not\nspeak to Celeborn"
  },
  {
    x: ["B", "D"],
    value: 40,
    name: "teaches Elves to\nmake things,\nhas flying servants"
  },
  {
    x: ["A", "B", "C"],
    value: 30,
    name: "benevolent,\nbig beard"
  },
  {
    x: ["B", "C", "D"],
    value: 30,
    name: "giver of gifts,\nis coming to town\nbling bling"
  },
  {
    x: ["A", "B", "D"],
    value: 30,
    name: "loves to sing,\nsees you"
  },
  {
    x: ["A", "C", "D"],
    value: 30,
    name: "lives in\nmiddle-earth"
  },
  {
    x: ["A", "B", "C", "D"],
    value: 5,
    name: "ancient,\npowerful,\nmysterious,\nmany names"
  }
];
The main stage is all set. Now, let me show you the last step to making the JS Venn diagram come to life!
4. Code the diagram
You will need to write just a few lines of JavaScript code to create a Venn diagram visualization of the ready dataset. Remember to place all of it inside the <script> tags in the body of your page.
The foremost thing you should do is include a function that ensures that the code will execute only after the web page has fully loaded:
<script>
  anychart.onDocumentReady(function() {
    // The following JavaScript charting code comes here.
  });
</script>
Now inside this function, copy the data from the previous step.
Then create a Venn diagram instance out of that data:
let chart = anychart.venn(data);Since the Venn diagram needs to show the text value and not the figure value, configure the label settings accordingly:
chart.labels().format("{%Name}");You can also give a title to the chart to make sure everyone understands what your Venn diagram is all about:
chart.title("Tolkien Venn Diagram");Finally, reference the previously added HTML block element (see the first step) and draw the chart:
chart.container("container");
chart.draw();
There you go, a basic JavaScript Venn diagram is up and running! Check it out with the entire code below and on CodePen [or on AnyChart Playground].
<!DOCTYPE html>
<html>
  <head>
    <title>JavaScript Venn Diagram</title>
    <script src="https://cdn.anychart.com/releases/8.11.0/js/anychart-core.min.js"></script>
    <script src="https://cdn.anychart.com/releases/8.11.0/js/anychart-venn.min.js"></script>
  </head>
  <body>
    <div id="container" style="width: 100%; height: 100%"></div>
    <script>
      anychart.onDocumentReady(function() {
        // adding data
        let data = [
          {
            x: "A",
            value: 100,
            name: "TOM BOMBADIL\n\nhomebody,\nblue jacket,\nboots yellow"
          },
          {
            x: "B",
            value: 100,
            name: "SANTA CLAUS\n\nwears red,\nho ho ho,\nsleigh"
          },
          {
            x: "C",
            value: 100,
            name: "GANDALF\n\nwizard,\nfireworks"
          },
          {
            x: "D",
            value: 100,
            name: "DARK LORD SAURON\n\n cute, evil,\nbabygirl, slay"
          },
          {
            x: ["A", "C"],
            value: 40,
            name: "special hat,\nlikes hobbits"
          },
          {
            x: ["A", "B"],
            value: 40,
            name: "merry fellow,\nwife guy"
          },
          {
            x: ["C", "D"],
            value: 40,
            name: "irritable,\nemo maia\nno wife,\nweirdly flirty with\nGaladriel in\nadaptations,\nwould rather not\nspeak to Celeborn"
          },
          {
            x: ["B", "D"],
            value: 40,
            name: "teaches Elves to\nmake things,\nhas flying servants"
          },
          {
            x: ["A", "B", "C"],
            value: 30,
            name: "benevolent,\nbig beard"
          },
          {
            x: ["B", "C", "D"],
            value: 30,
            name: "giver of gifts,\nis coming to town\nbling bling"
          },
          {
            x: ["A", "B", "D"],
            value: 30,
            name: "loves to sing,\nsees you"
          },
          {
            x: ["A", "C", "D"],
            value: 30,
            name: "lives in\nmiddle-earth"
          },
          {
            x: ["A", "B", "C", "D"],
            value: 5,
            name: "ancient,\npowerful,\nmysterious,\nmany names"
          }
        ];
        // creating a venn diagram with the data
        let chart = anychart.venn(data);
        // setting the labels
        chart.labels().format("{%Name}");
        // setting the chart title
        chart.title("Tolkien Venn Diagram");
        // setting the container id
        chart.container("container");
        // drawing the diagram
        chart.draw();
      });
    </script>
  </body>
</html>
Customizing JavaScript Venn Diagram
Just like the writer creates the first draft of a book and then adds revisions to improve it, you can tweak your Venn diagram so it looks better and exactly the way you want. I will show you how to make some quick customizations. All the changes will be consecutively pushed to the basic one. The final Venn diagram example of the tutorial will look very similar to the original one.
1. Disable the legend
The basic Venn diagram built by this moment has a legend below the chart itself, created automatically. In this case, it appears to be redundant, as the names are already displayed in the circles. When you don’t need a legend, you can disable it and get a cleaner look of the chart.
chart.legend(false);2. Tune the labels
You may also like to modify the text settings of the Venn’s labels. For example, change the font size, color, weight, and text alignment for a visually refined look. Remember that the intersection labels can be customized separately, which will override the general label settings.
// setting the labels
chart
  .labels()
  .fontSize(14)
  .fontColor("#000")
  .hAlign("center")
  .vAlign("center")
  .fontWeight("500")
  .format("{%Name}");

// setting the intersection labels
chart
  .intersections()
  .labels()
  .fontSize(11)
  .fontColor("#000")
  .format("{%Name}");
3. Set custom colors
I feel that any chart looks so much more personalized when the colors are specified according to the data points. But it’s totally up to you, of course. Here, let’s add the fill attribute for each data point in the normal state, which means when the points are neither hovered nor selected. (You can adjust the appearance in the hovered or selected states in the same manner.)
One example of how such settings can be applied to each data point is as follows:
let data = [
  {
    x: "A",
    value: 100,
    name: "TOM BOMBADIL\n\nhomebody,\nblue jacket,\nboots yellow",
    normal: { fill: "#afb5f1 0.7" }
  },
  …
];
4. Enhance the title
To make the title of your Venn diagram more informative and attractive, it’s easy to format it using HTML. For example:
chart
  .title()
  .enabled(true)
  .useHtml(true)
  .text(
    "<span style = "color: #000; font-size:18px;">Fun Venn Diagram Showing J.R.R. Tolkien"s Characters</span>" +
      "<br/><span style="font-size: 15px; color:#cf0011'>(with Santa Claus)</span>"
  );
5. Improve the tooltip
And now, just a quick trick to fine-tune the tooltip look by getting rid of unnecessary elements:
chart.tooltip().format("");
chart.tooltip().separator(false);
Here’s how the resulting Venn diagram looks after all these customizations! Check out its interactive version with the full code on CodePen [or on AnyChart Playground].
6. Add an extra character
The JS-based Venn diagram built so far is similar to the one that gave me inspiration and is exactly how I wanted to make it look. But Tea with Tolkien did not stop at that point and also added Saruman! Well, let’s do it, too!
Actually, everything remains the same, and it’s only needed to add the necessary data for Saruman and his intersections with the other characters. Here’s the entire dataset:
let data = [
  {
    x: "A",
    value: 100,
    name: "TOM BOMBADIL\n\nhomebody,\nblue jacket,\nboots yellow",
    normal: { fill: "#afb5f1 0.7" }
  },
  {
    x: "B",
    value: 100,
    name: "SANTA CLAUS\n\nwears red,\nho ho ho,\nsleigh",
    normal: { fill: "#fb7571 0.7" }
  },
  {
    x: "C",
    value: 100,
    name: "GANDALF\n\nfireworks,\nlikes adventures",
    normal: { fill: "#c7c2bd 0.7" }
  },
  {
    x: "D",
    value: 100,
    name: "DARK LORD SAURON\n\n cute,\nbabygirl, slay",
    normal: { fill: "#f9eb97 1" }
  },
  {
    x: "E",
    value: 50,
    name: "SARUMAN\n\ncrazy long\nfingernails,\nrainbow cloak"
  },
  {
    x: ["A", "C"],
    value: 40,
    name: "special hat,\nlikes hobbits",
    normal: { fill: "#99a0df 0.7" }
  },
  {
    x: ["A", "B"],
    value: 40,
    name: "merry fellow,\nwife guy",
    normal: { fill: "#b17cb8 0.7" }
  },
  {
    x: ["C", "D"],
    value: 40,
    name: "flirty with \nGaladriel in \nadaptations",
    normal: { fill: "#e3b55f 1" }
  },
  {
    x: ["B", "D"],
    value: 40,
    name: "teaches Elves to\nmake things,\nhas flying servants",
    normal: { fill: "#fd8f38 0.7" }
  },
  {
    x: ["C", "E"],
    value: 10,
    name: "wizard,\npipe-weed\nknows about\nhobbits"
  },
  {
    x: ["D", "E"],
    value: 10,
    name: "wants Ring,\nevil,\nmagic voice"
  },
  {
    x: ["A", "B", "C"],
    value: 30,
    name: "benevolent,\nbig beard",
    normal: { fill: "#a671af 0.7" }
  },
  {
    x: ["B", "C", "D"],
    value: 30,
    name: "giver of gifts,\nis coming to town,\nbling bling",
    normal: { fill: "#f1842f 1" }
  },
  {
    x: ["A", "B", "D"],
    value: 30,
    name: "loves to sing,\nsees you",
    normal: { fill: "#b2879b 1" }
  },
  {
    x: ["A", "C", "D"],
    value: 30,
    name: "lives in\nmiddle-earth",
    normal: { fill: "#a69ab0 1" }
  },
  {
    x: ["C", "D", "E"],
    value: 30,
    name: "irritable,\n emo maia\nno wife",
    normal: { fill: "d2a452 0.2" }
  },
  {
    x: ["A", "B", "C", "D"],
    value: 5,
    name: "ancient,\npowerful,\nmysterious,\nmany names",
    normal: { fill: "#ab8298 1" }
  }
];
See how this JavaScript Venn diagram looks now! Check it out with the full code on CodePen [or on AnyChart Playground].
Conclusion
Some knowledge of HTML and JavaScript is always advantageous. But you see, now you know how to create a Venn diagram even without much of it. Such a visualization will be interactive and embeddable to any web page or app. Let me know if you have any questions.
The basic steps remain the same for other chart types as well as other libraries — give that a try, create some magic, and let us all check out what you’ve got!
Published with the permission of Shachee Swadia. Originally appeared on Bootcamp by UX Collective with the title “How to create a Venn diagram with JavaScript” on February 22, 2023.
You may also like to check out the JavaScript Venn Diagram Tutorial produced by Shachee Swadia especially for our blog and originally published here earlier.
Don’t miss out on more JavaScript charting tutorials on our blog.
- Categories: AnyChart Charting Component, Charts and Art, HTML5, JavaScript, JavaScript Chart Tutorials, Tips and Tricks
- No Comments »