 DataViz Weekly consistently curates the most awesome new data visualization works that might serve as an inspiration for your own great projects. Check out what we’ve got for you today!
- Russian influencers in Europe — Texty
- Fast food prices across the United States — Riley Walz
- Split delegations in the U.S. Senate since 1914 — Reuters
- Disadvantaged communities across the U.S. — CEQ
Data Visualization Weekly: December 2, 2022 — December 9, 2022
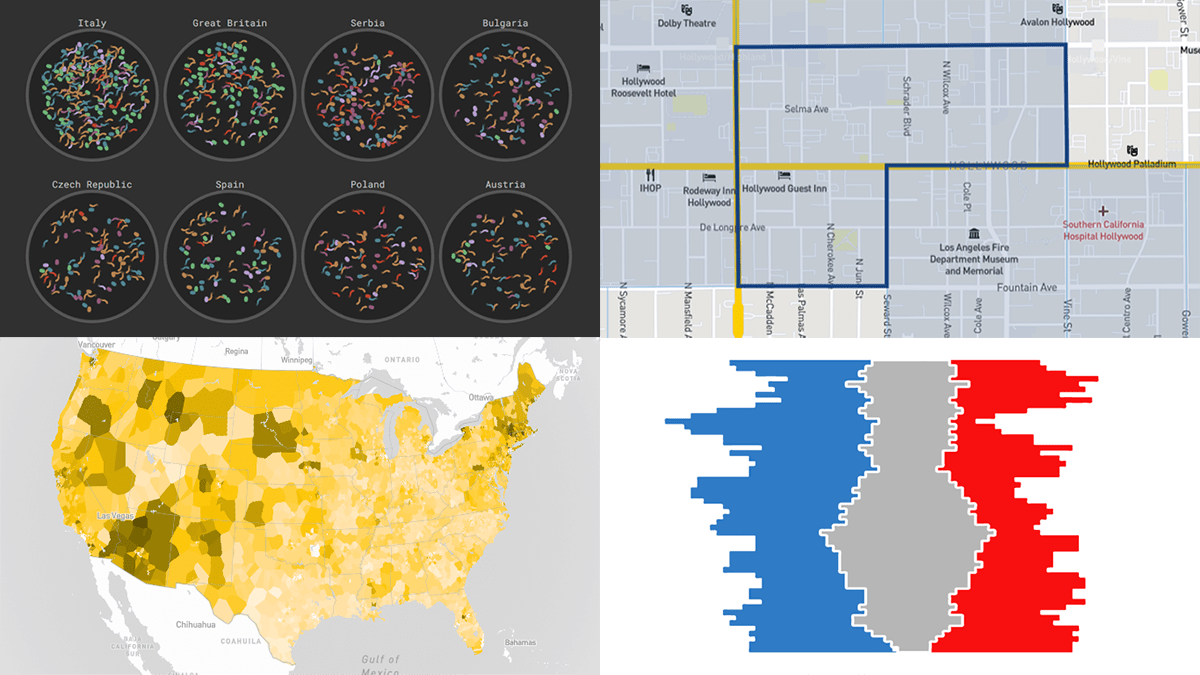
Russian Influencers in Europe
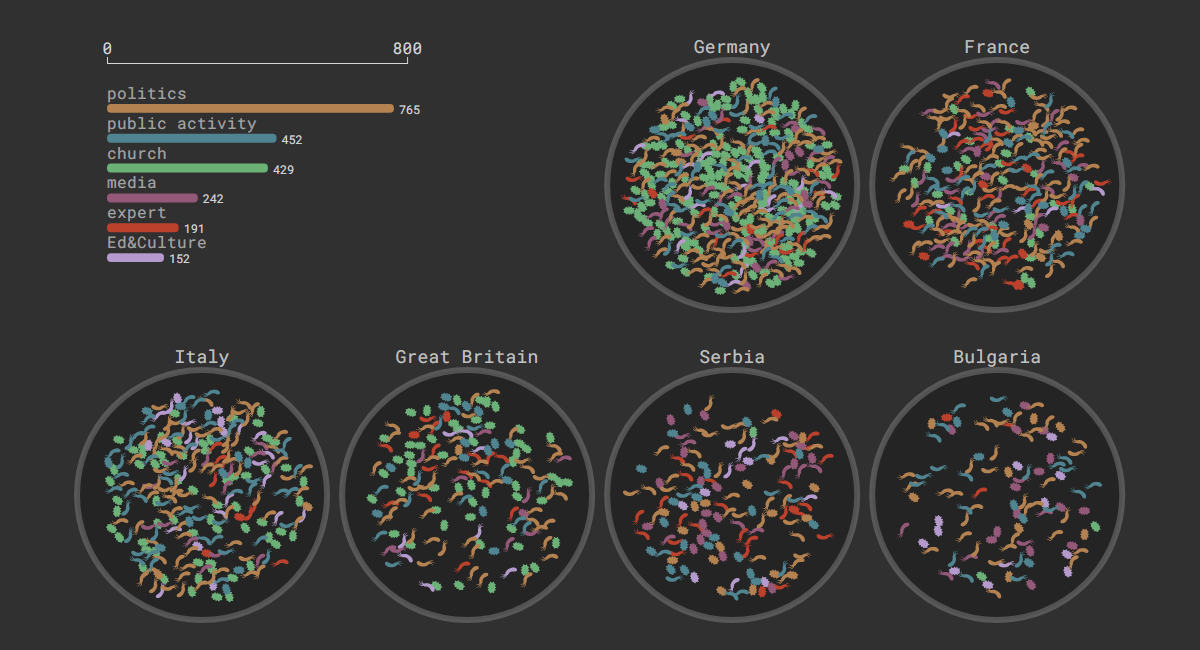
Europe is reported to be quite united in supporting Ukraine. But there are also many groups promoting the so-called “Russian world” throughout the continent.
TEXTY looked into the networks of Russian influence in Europe with the help of open sources of information. As a result of this work, its journalists identified over 900 organizations and 1,300 individuals they suspect to be Russia’s potential agents. Those include entities and people acting in various fields, from education and church to media and top-tier politics.
Explore the alleged Russian influencers across Europe using an interactive map and other visualizations on TEXTY.
Fast Food Prices Across U.S.
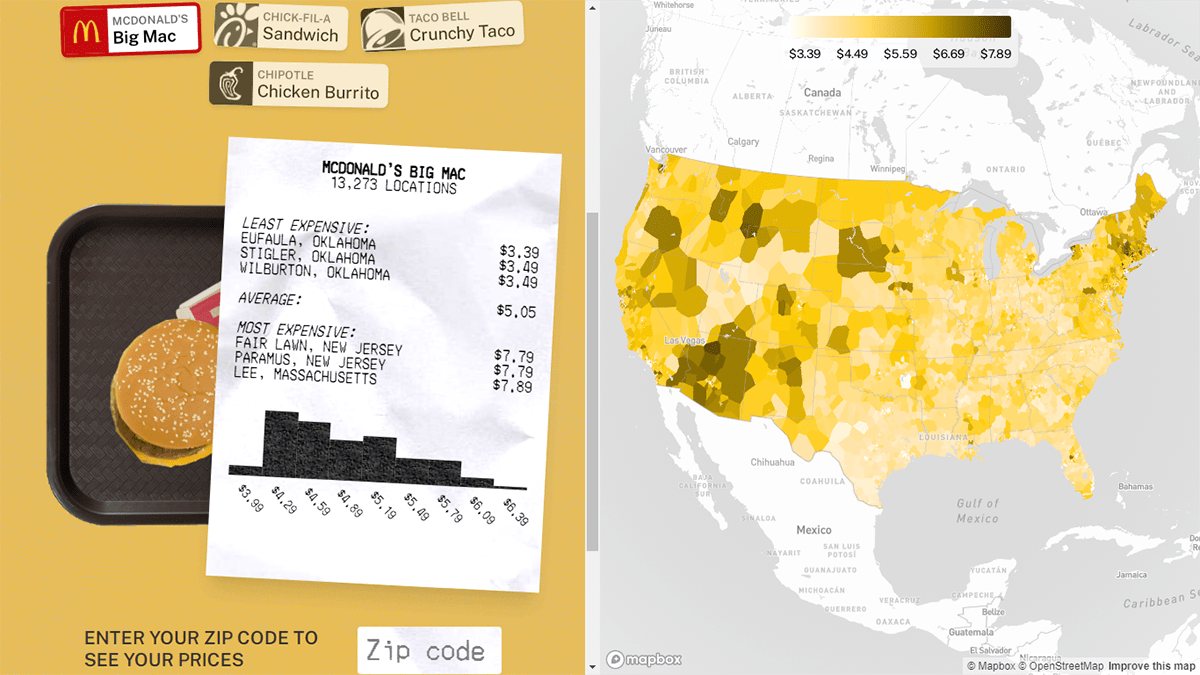
Comparing the prices of a Big Mac in different countries is a famous informal way to measure the purchasing power parity (PPP) between the respective national currencies. However, a Big Mac can cost different amounts of money even across a single country.
Riley Walz compared the prices of a Big Mac, Chicken Sandwich, Crunchy Taco, and Chicken Burrito in every single store of (respectively) McDonald’s, Chick-Fil-A, Taco Bell, and Chipotle across the United States. The differences may well be seen as indicating regional disparities in the cost of living. You can easily spot them by looking at Riley’s interactive choropleth map, the focal point of his Fast Food Index project.
Check out the map and more at fastfoodindex.walzr.com.
Split Delegations in U.S. Senate Since 1914
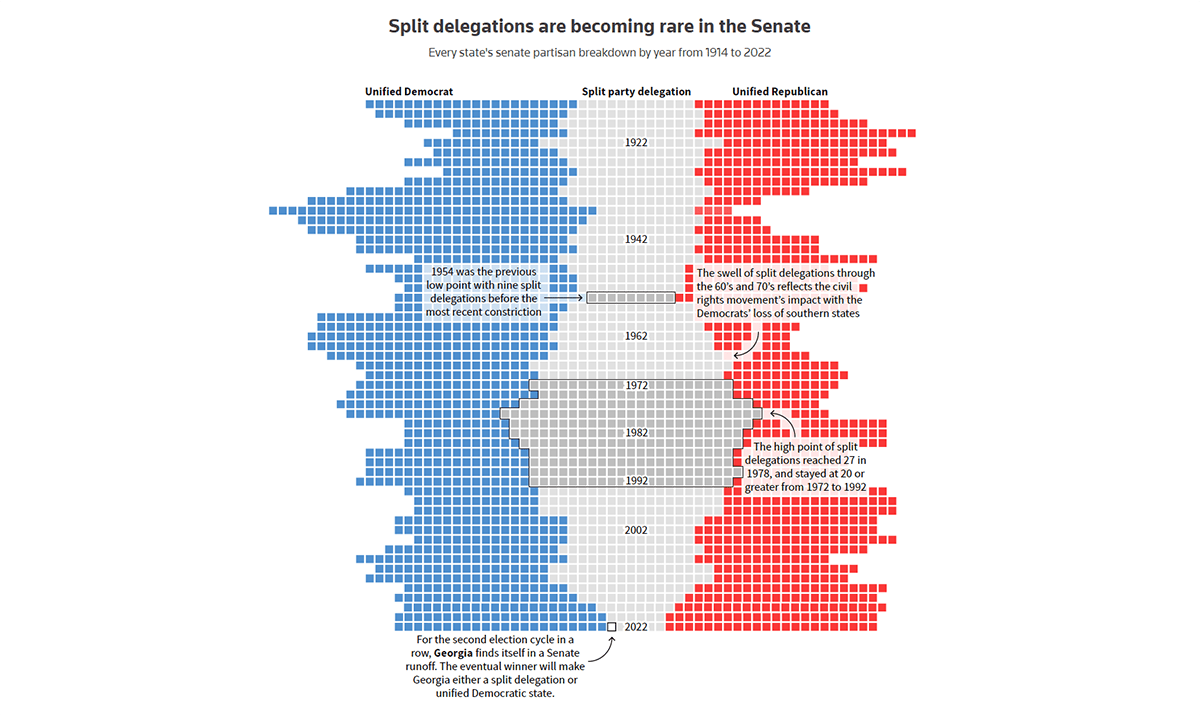
After Democrat Raphael Warnocke’s successful defense of his seat in the Senate at Georgia’s runoff election, the number of states with senators from different parties remained six, the same as after the 2020 elections and the smallest in the last century.
For Reuters, Travis Harman and Jason Lange visualized every state’s senate partisan breakdown by year between 1914 and 2022. As you can clearly see, split delegations have been on a decline. This marks growing regional divisions between Republicans and Democrats.
Take a closer look at the chart on Reuters.
Disadvantaged Communities Across U.S.
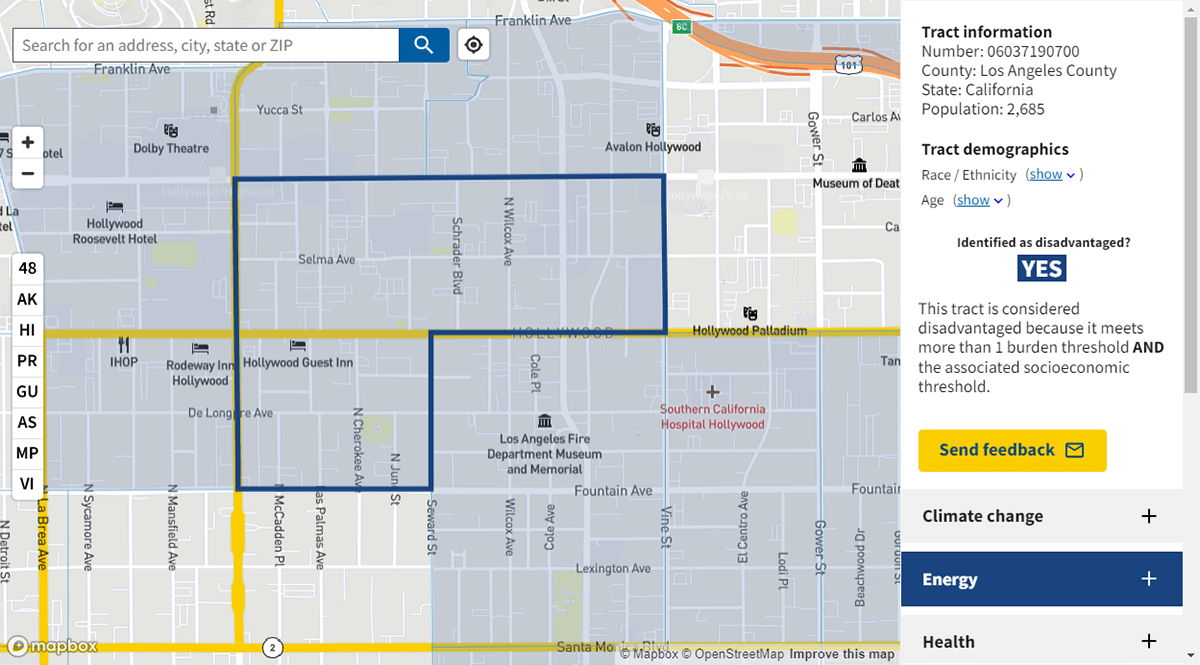
The White House’s Justice40 Initiative aims to target certain federal funds at so-called “disadvantaged” communities, those overburdened by climate, pollution, and historical underinvestment. But before all, such communities must be identified.
The Council on Environmental Quality (CEQ) released the Climate and Economic Justice Screening Tool (CEJST) designed to solve this issue. Technically, it is an interactive map that shows, by census tract, which areas are considered disadvantaged and allows you to find out why. You can enter an address to see how that location fares and ranks compared to others by a number of social, economic, and environmental metrics.
See the tool at screeningtool.geoplatform.gov.
***
Found or created an awesome data visualization? Let us know and we will be happy to consider featuring it!
And stay tuned for Data Visualization Weekly!
- Categories: Data Visualization Weekly
- No Comments »