 DataViz Weekly welcomes you! Check out four new data visualization projects that have impressed us the most during the last seven days!
- America’s path to one million COVID-19 deaths — The New York Times
- Flooding and wildfire risks for properties across the U.S. — First Street Foundation
- Sea level rise along New Zealand’s coast — NZ SeaRise
- Traffic fatalities in San Francisco — Stephen Braitsch
Data Visualization Weekly: May 13, 2022 — May 20, 2022
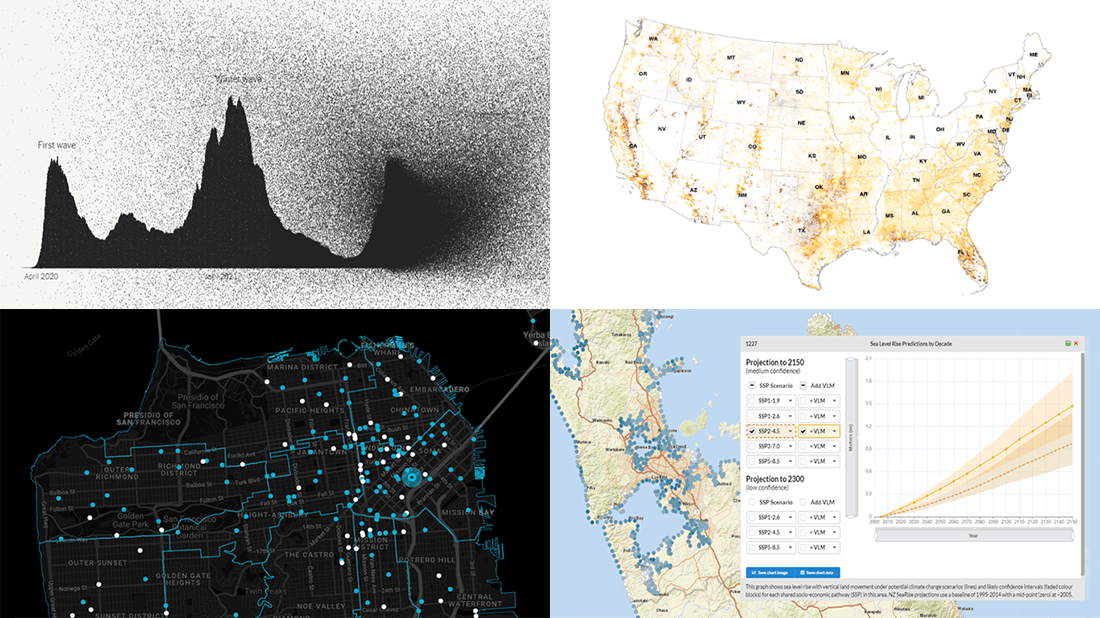
America’s Path to One Million COVID-19 Deaths
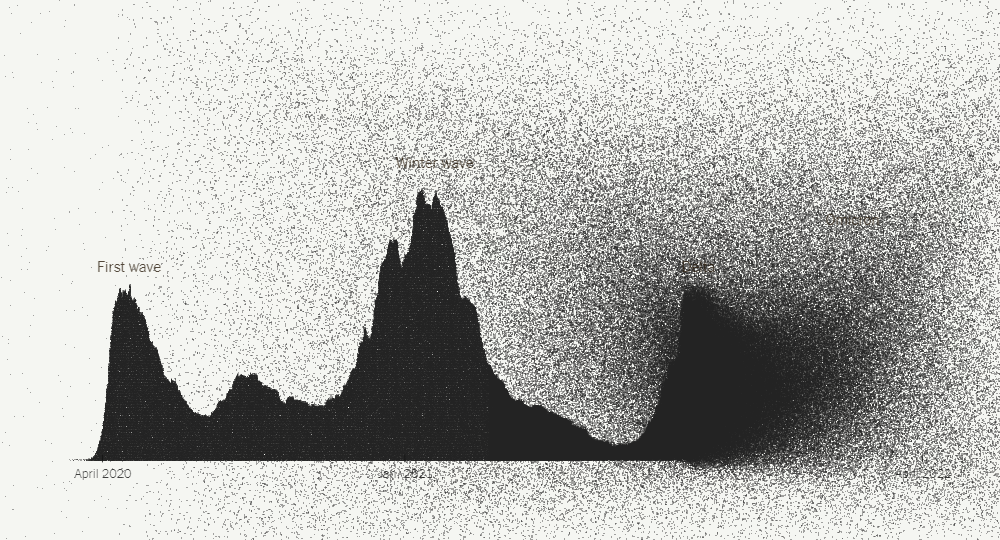
When the pandemic started, hardly many of us could imagine it would take so many lives. This week, the United States has surpassed the threshold of one million deaths from COVID-19, a toll that is nearly impossible to grasp.
The New York Times made an impressive attempt to visualize America’s path to this huge death toll. What you see at the beginning of the story is one million dots, each representing a victim of the novel coronavirus. As you scroll, the dots get arranged into chart and map visualizations, providing a striking illustration of how the one million is made up and how the country failed them.
See how the U.S. reached this death toll, on the NYT website. The story was created by Jeremy White, Amy Harmon, Danielle Ivory, Lauren Leatherby, Albert Sun, and Sarah Almukhtar.
Flooding and Wildfire Risks for Properties Across U.S.
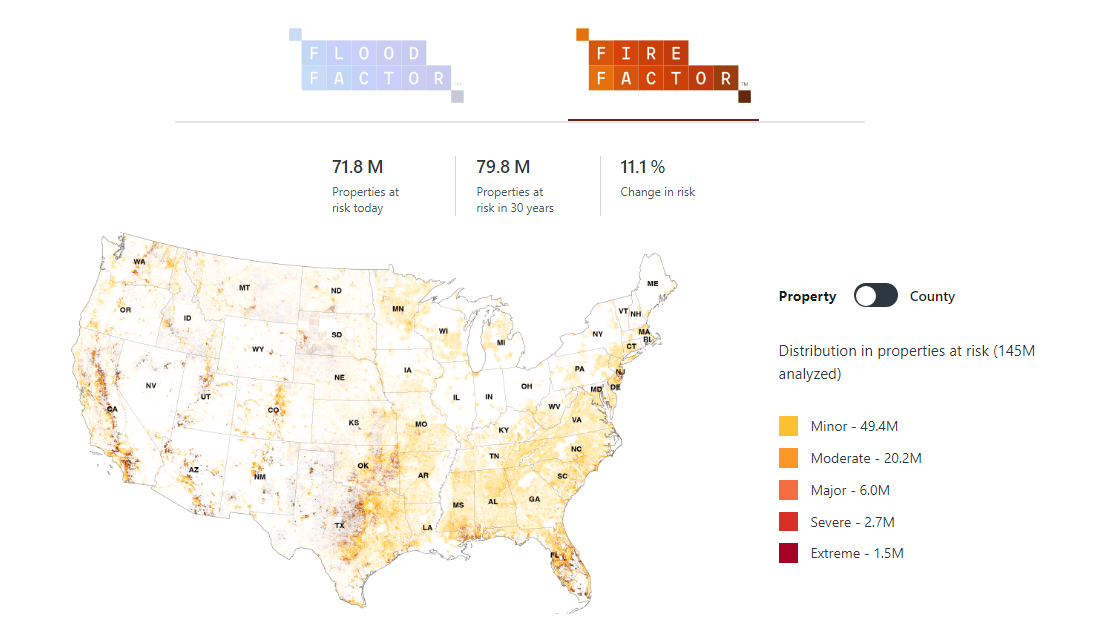
We once told you about the Flood Factor database released by First Street Foundation, which revealed estimated chances of flooding for more than 142 million properties across the U.S. Now the project has been updated and expanded.
The new Risk Factor website from First Street Foundation allows you to check your home’s risks from both flooding and wildfire. Just enter an address and you will be able to explore past events, present risks, and future projections for the corresponding location and nearby.
Check out the tool for a property-level view of climate risks across America.
Sea Level Rise Along New Zealand’s Coast
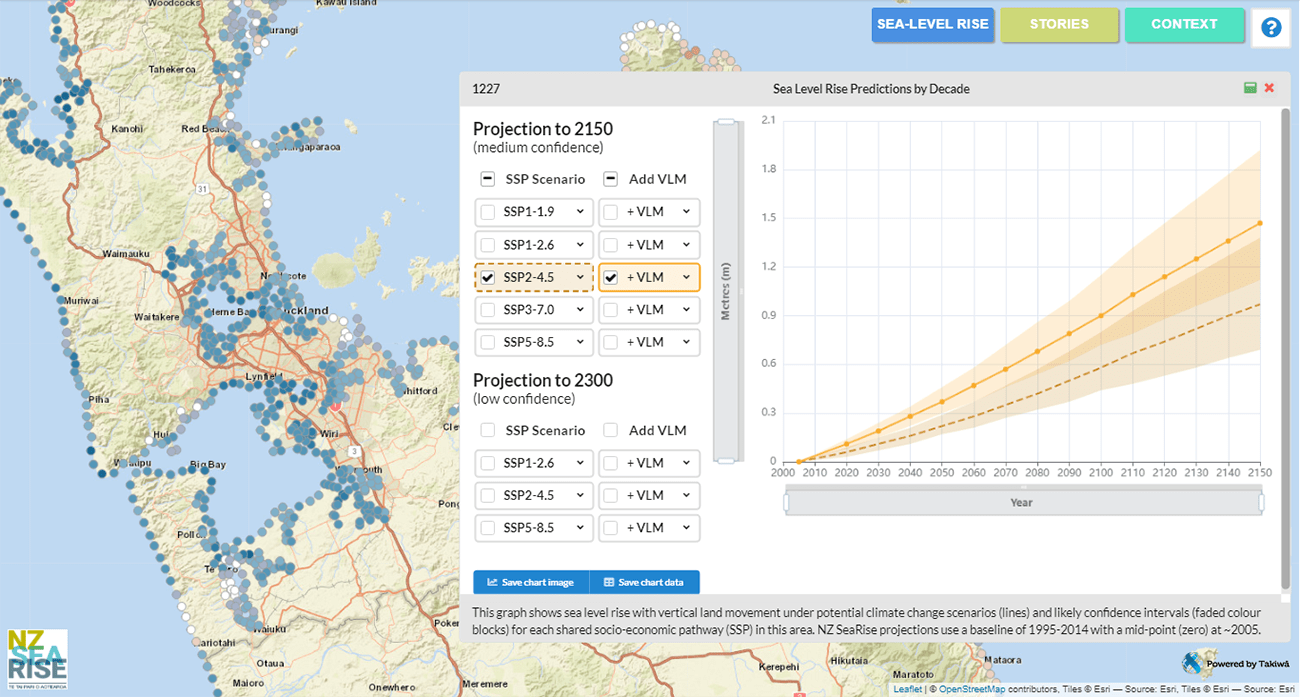
One of the consequences of climate change is the rise of sea level. This issue is expected to affect all countries along the coastline. Take a look at New Zealand, for example.
NZ SeaRise, a research program funded by the country’s Ministry of Business, Innovation, and Employment, launched an interactive map that displays how much sea level could rise around the coast of Aotearoa under different possible climate change scenarios. In addition, New Zealand is tectonically active. So the map also includes data on the estimated rate and direction of vertical land movement. And if you click on a dot, you will see a chart visualizing the projections for that location.
Find out how the rising sea level is predicted to impact different places all over New Zealand’s coastline, on the Takiwā data analytics platform.
Traffic Fatalities in San Francisco
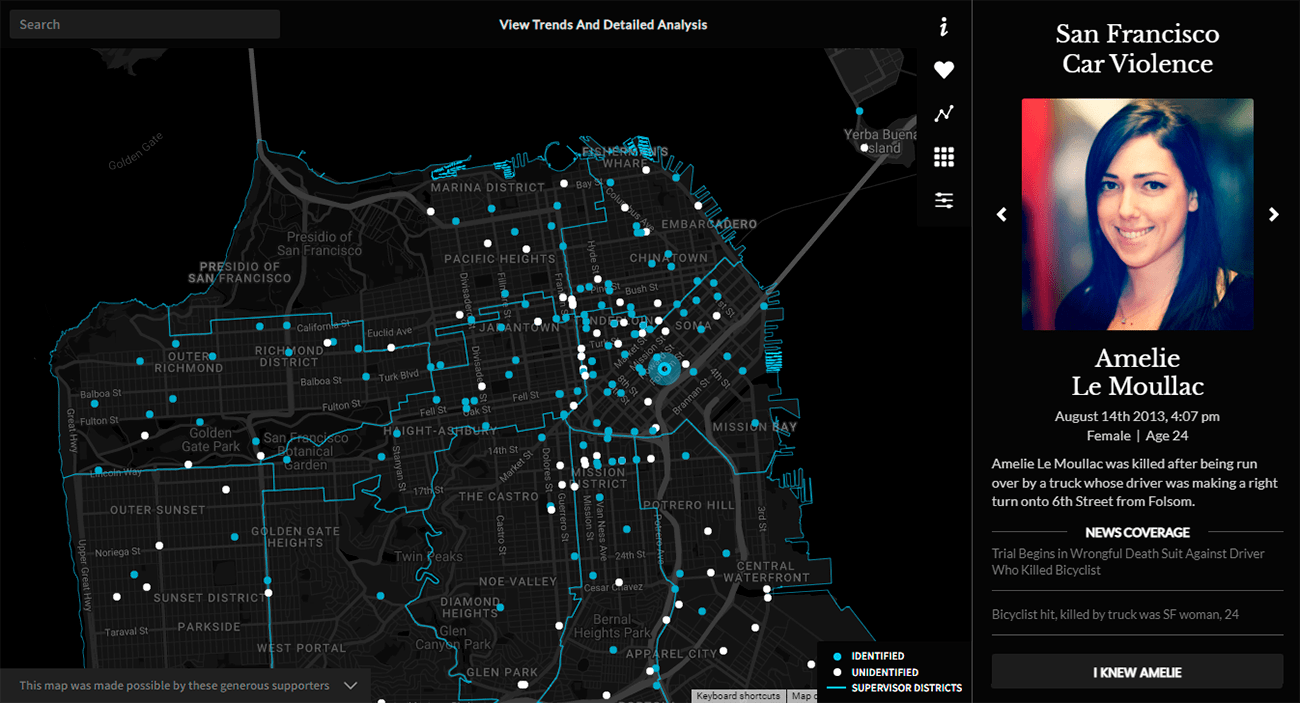
In San Francisco, someone is killed by a car every 13.24 days on average. That is according to data from the San Francisco Department of Public Health (SFDPH).
Stephen Braitsch, a data analyst and engineer, made an interactive map visualizing the location of all traffic-related fatalities that have occurred in the city since the adoption of the Vision Zero initiative for road safety in 2014. The project is much more than a display of the accidents’ locations, though. It also identifies the victims and analyzes the circumstances of each crash. And if you click on the “View Trends And Detailed Analysis” button, you’ll be shown various charts providing more insight.
Look into the data about car violence in San Francisco, on the Transpo Maps website.
***
We appreciate your interest and attention. Stay tuned for our Data Visualization Weekly digests.
- Categories: Data Visualization Weekly
- No Comments »