 Excited to tell you we’ve just pushed a major update to our JavaScript charting library! The newly arrived features and improvements make our core solution even more flexible, adding awesome fresh capabilities designed to further help you on your data visualization development journey. Intrigued? Let us show what’s new in AnyChart JS Charts 8.11.0 right away!
New Features in AnyChart JS Charts
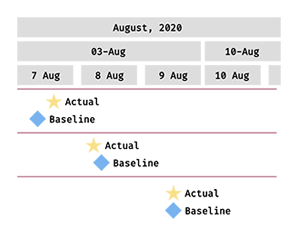 |
Baseline Milestones in Gantt ChartMilestones can now be put on not only actual but also baseline elements, which makes project planning and tracking with our Gantt charts even more efficient and streamlined. So first you can schedule any important dates such as meetings, approvals, phase completions, and other major events or goals. Then it is easy to visually compare the actual milestone dates to the initial, baseline project plan. Check out an example of a Gantt chart with a baseline milestone in our gallery. |
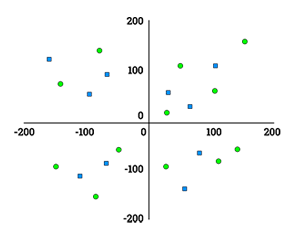 |
Custom Axis PlacementWe have added the option to draw the X and Y axes anywhere on the chart. Previously, you could only set them to the fixed top or bottom and left or right positions, respectively. Now, you have full control over the scale values at which the axis lines appear and therefore where they cross. For instance, now you can easily make both axes go through the origin point (0, 0) in graphs with negative values. Check out an example of a column chart with custom axis placement in our gallery. |
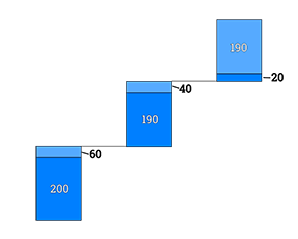 |
Outside Labels in Waterfall ChartIn waterfall charts, now it is possible to caption small elements in a neatly elegant way with ease. If a data label does not fit in the bounds of its data point, you can place it outside of the bar. Such outside labels can be especially helpful in stacked waterfall charts that display multiple series on the same plot. Check out an example of a waterfall chart with outside labels in our gallery. |
Improvements in AnyChart JS Charts
That’s not all the new release brings! We have also made a number of improvements to the existing charting mechanisms.
For example, now you can easily do the following in waterfall charts:
- Add and configure the total and subtotal bars as independent elements.
- Split the total bar into multiple bars representing user-defined values or expressions.
- Display stack labels in single-series visualizations.
And in stock charts:
- Use plot controls via the API.
- Add series point-related events.
Check the version history of the JS charts library product you are using to keep up with all the latest updates:
Enjoy AnyChart JS Charts 8.11.0 and do let us know what you want us to add or improve next!
- Categories: AnyChart Charting Component, AnyGantt, Gantt Chart, HTML5, JavaScript, News
- 3 Comments »
Comments (3)
I need the template please
Hi, could you please specify exactly which template you are looking for?
Meanwhile, the following links may be helpful, but if not, you are more than welcome to reach out to our Support Team. Thanks.