 Hey everyone! It is Friday, and we are here to put a spotlight on the most compelling examples of sensible data visualization we have recently seen around the internet. As always, let’s start with a quick list and then look at each project. All aboard for DataViz Weekly!
- Intensive care unit occupancy rates in the United States — The New York Times
- Minority unemployment rates in 15 large U.S. cities. — Bloomberg
- Early proposals for congressional redistricting in Oregon, Indiana, and Colorado — The Washington Post
- Time use of American men and women by employment status — Nathan Yau
Data Visualization Weekly: September 17, 2021 — September 24, 2021
Intensive Care Unit Occupancy Rates in U.S.
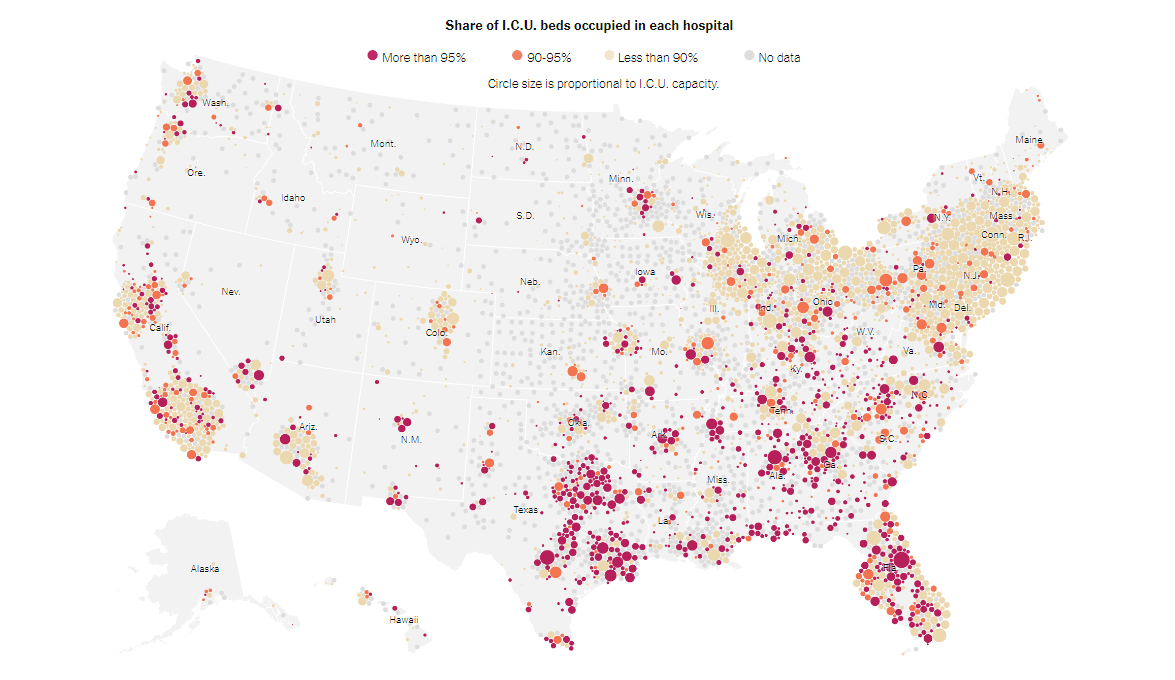
As COVID-19 cases have spiked with the hit of the Delta variant, a quarter of all intensive care unit beds in the United State are already occupied at a rate of more than 95% — up from one in five in August and less than one in ten in July. The hospitalization crisis is especially acute in southern regions.
Charlie Smart from The New York Times visualized the rates of I.C.U. occupancy across the U.S. based on data from the Department of Health and Human Services (DHHS), providing insight into the current situation.
His recent article begins with a colored bubble map that displays the share of intensive care beds currently unavailable in each American hospital. The other visualizations put a focus on the dramatic change. Two choropleth maps display a big picture, representing I.C.U. occupancy by hospital service area as registered in July and September, respectively. They are followed by beeswarm charts that provide snapshots for the occupancy of intensive care units in each hospital as of two months ago versus nowadays for three individual states: Alabama, Texas, and Florida.
Look at the scale of the problem and where it is especially large, on NYT.
Minority Unemployment Rates in 15 Large U.S. Cities.

Fueled by vaccine eligibility expansion and stimulus measures, the U.S. economy has shown signs of recovery. Minority communities, however, are likely to be increasingly left behind.
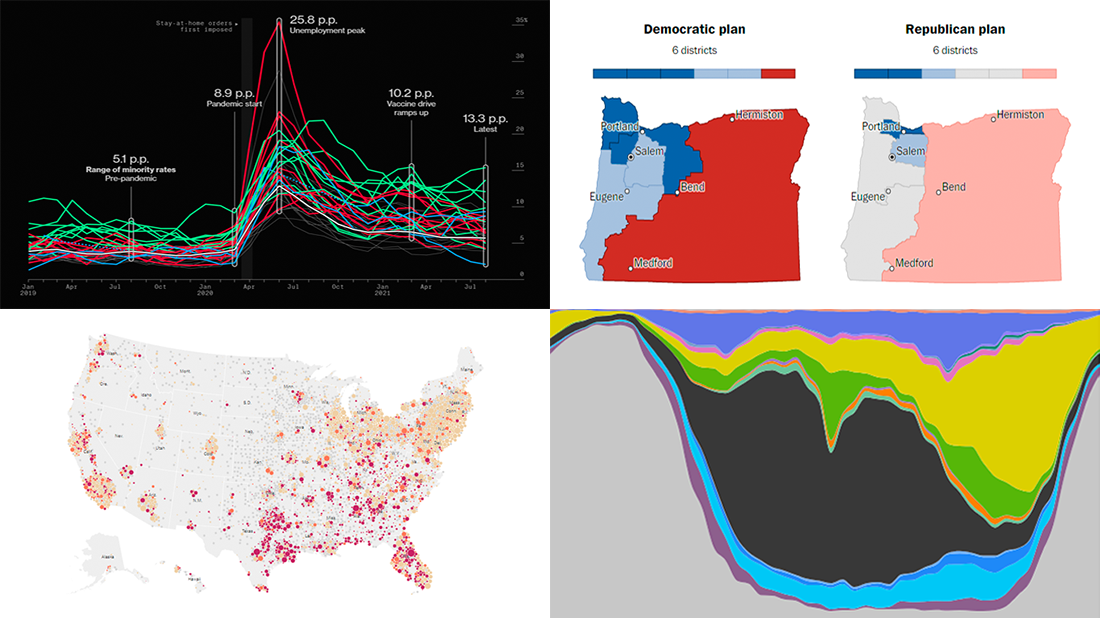
Bloomberg identified a widening racial gap in unemployment. Its journalists Jill R. Shah, Andre Tartar, and Christopher Cannon analyzed local jobless rates in fifteen large metropolitan areas around the country using data from the Current Population Survey. What they found was a significantly weaker recovery in Black and Hispanic groups compared to White.
You can take an in-depth look at the situation by exploring the line charts published on Bloomberg earlier this week. The graphics represent a breakdown of local unemployment rates by race and ethnicity over time since 2019 — for Albuquerque, Atlanta, Chicago, Dallas, Houston, Las Vegas, Los Angeles, Miami, New York, Philadelphia, Phoenix, Riverside, San Antonio, San Francisco, and Washington, D.C. First all together as shown in the picture above. Then by city, telling more in the scrollytelling format.
Early Proposals for Congressional Redistricting in Oregon, Indiana, Colorado
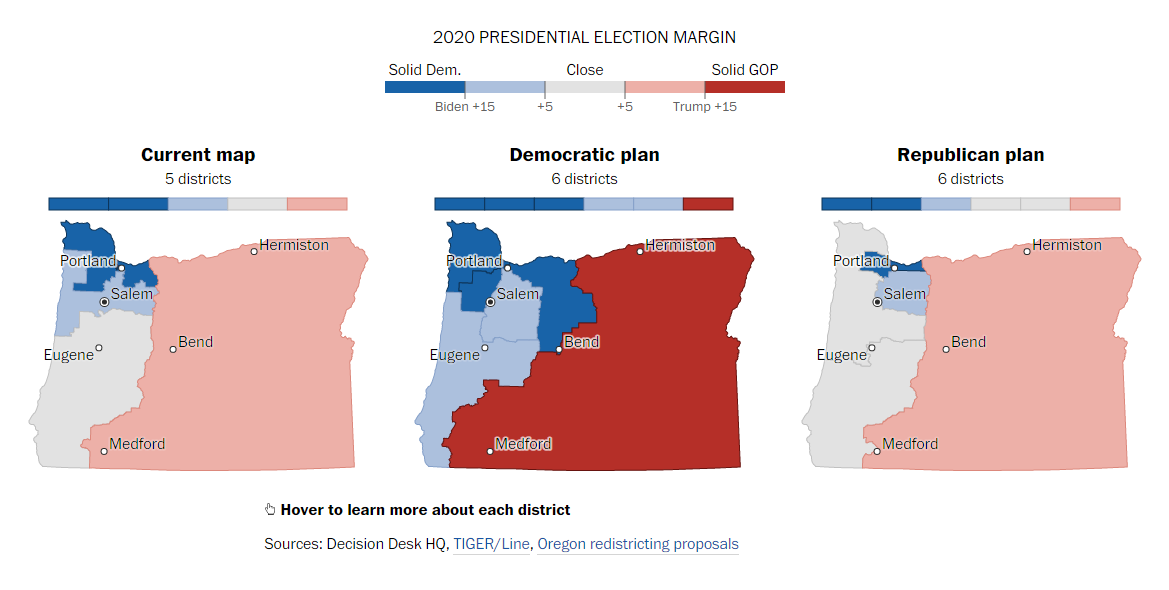
In the first September issue of DataViz Weekly, we told you about The Washington Post’s handy visual guide to how congressional redistricting works across the U.S. Now, one month after the official release of the results of the 2020 Census, proposals for how new electoral district boundaries should look are already out in several states.
Harry Stevens, The Washington Post, decided to look at the currently available proposals from mapmakers in Oregon, Indiana, and Colorado to see how they could change the political landscape. So, he mapped them out and analyzed them based on the results of the 2020 U.S. presidential election at the precinct level.
Check out the interactive maps on The Post. They greatly show it all at a glance.
Time Use of American Men and Women by Employment Status
Now, get ready for some of the most beautiful 100 percent stacked area charts!
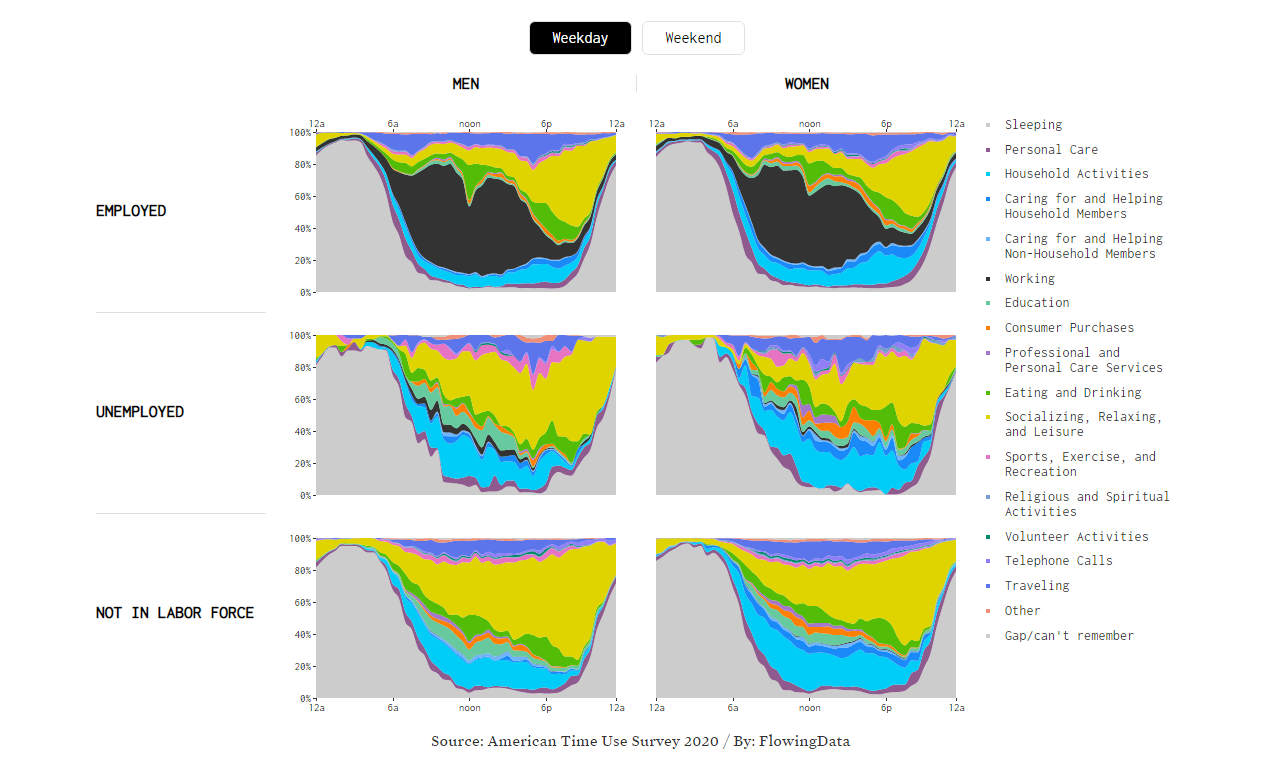
Nathan Yau continued to look at how people in the United States spend their time. Using data from the 2020 American Time Use Survey, he plotted the percentage of Americans working, eating, sleeping, buying, caring, socializing, calling, traveling, and doing other activities over the course of a usual day.
There are a total of twelve charts in the set, providing a great opportunity for easy comparisons between women and men across three employment statuses (employed, unemployed, and outside the labor force), plus it is possible to switch from weekday to weekend.
The charts are interactive and you can click on an activity to see it individually. See them on FlowingData.
***
Thanks for your attention! Stay tuned for DataViz Weekly and keep alerting us on new data visualization projects worth checking out and featuring!
- Categories: Data Visualization Weekly
- No Comments »