 As global leaders in data visualization solutions, we feel it is part of our mission to support educational and research projects by granting their authors a free license to use our products. Les Énigmes de Mercure (The Riddles of Mercury) by Timothée Léchot from the University of Neuchâtel (UniNE) is one such initiative we are proud to back on non-commercial terms.
Recently, we had a quick talk with Timothée and asked him a few questions to learn more about his project and experience visualizing data with the AnyChart JS charting library. Read our quick interview below. (Stack: PHP/MySQL.)
AnyChart: Hello Timothée! To begin with, could you please briefly tell our community about yourself? Where are you from and what do you do?
Timothée Léchot: Hi, I am from Switzerland and work as a postdoc at the University of Neuchâtel. My research focuses on the history of French literature and media, with a particular interest in the eighteenth century.
A: What is the idea behind Les Énigmes de Mercure and how did you come up with it?
TL: My project deals with literary games in the press of the Ancien Régime. Long before the invention of the crossword, readers in the seventeenth and eighteenth centuries played riddle games: newspapers published enigmatic poems — enigmas, logogriphs, and charades — that some readers composed and other readers tried to guess. What is special about these riddles is that they were almost always poetry.
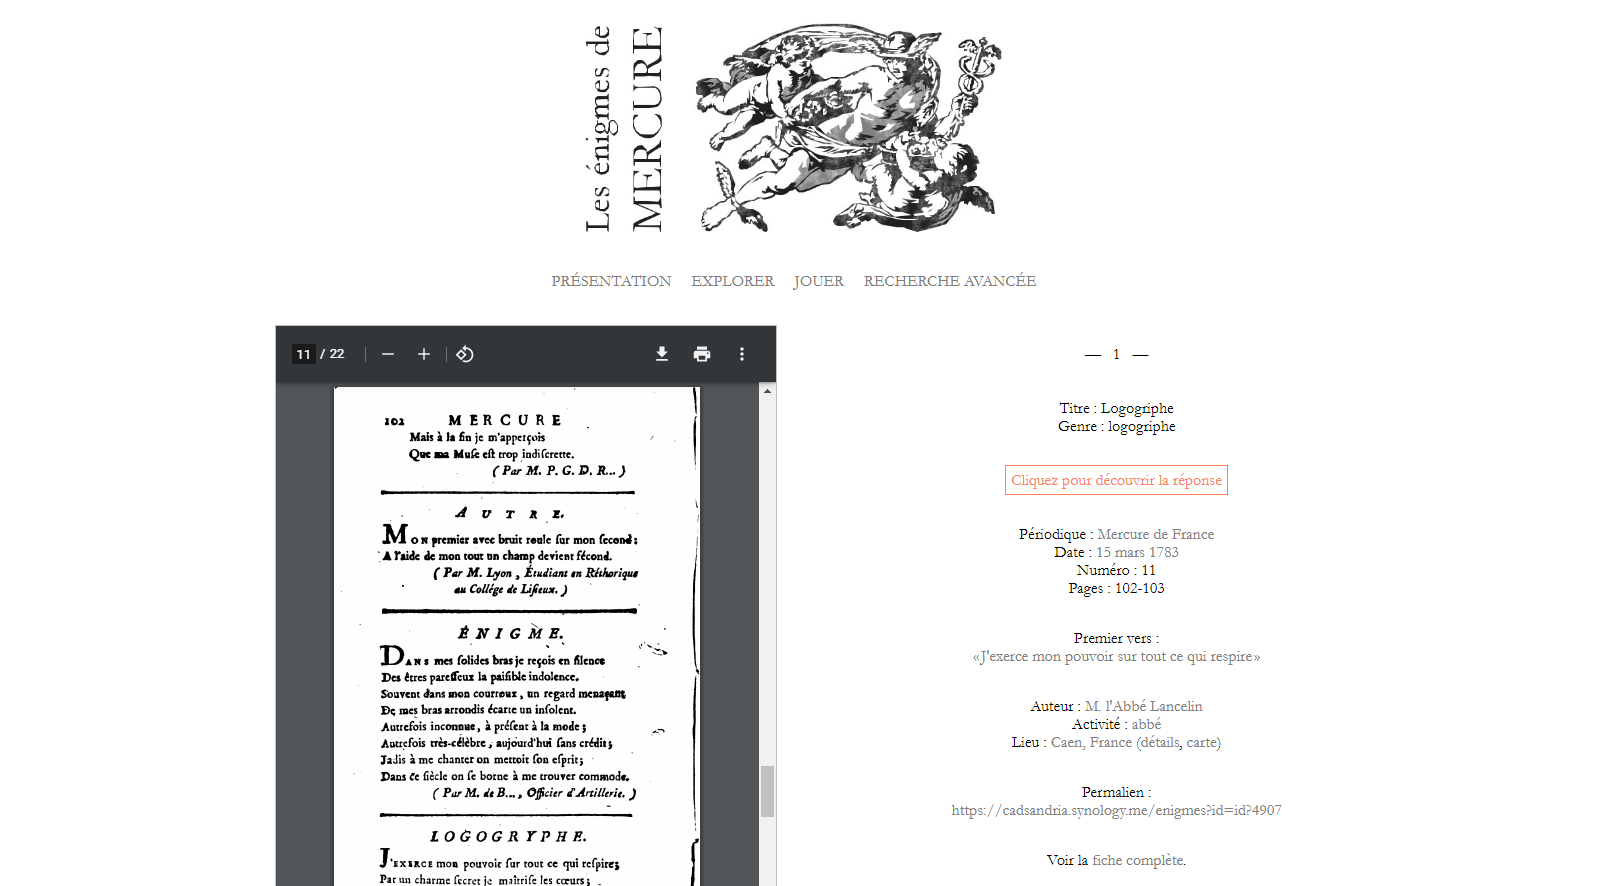
Having realized that this minor literature was little studied and that it could still interest us, and even entertain us, I compiled a database of all the riddles published in the magazine Mercure galant (which later became Mercure de France) between 1672 and 1800. This collection contains nearly 7,000 riddles with their answers and data on their authors.
A: What does this project look like now?
TL: Basically, Les Énigmes de Mercure consists of a website, which is now complete, allowing everyone to explore the database of the riddles and even play them, and scientific publications in the form of articles and text editions. The preparation of a short monograph is in progress.
A: Why do you need data visualization in your project?
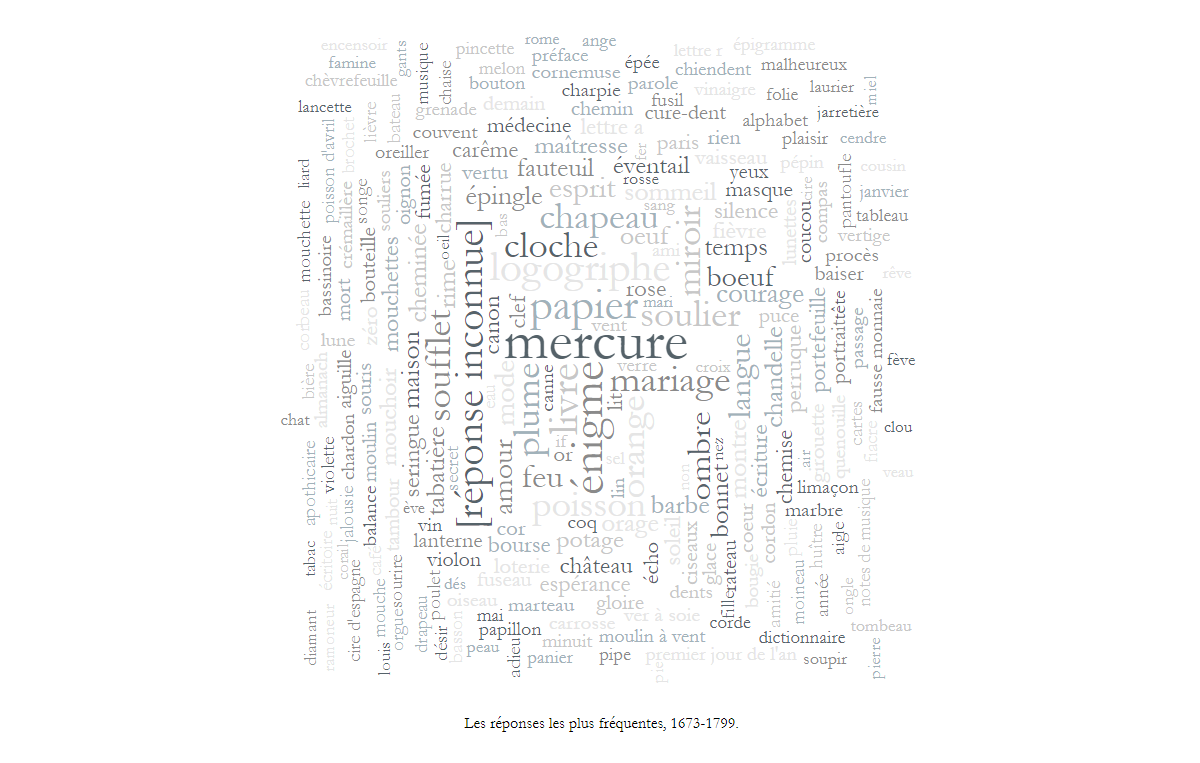
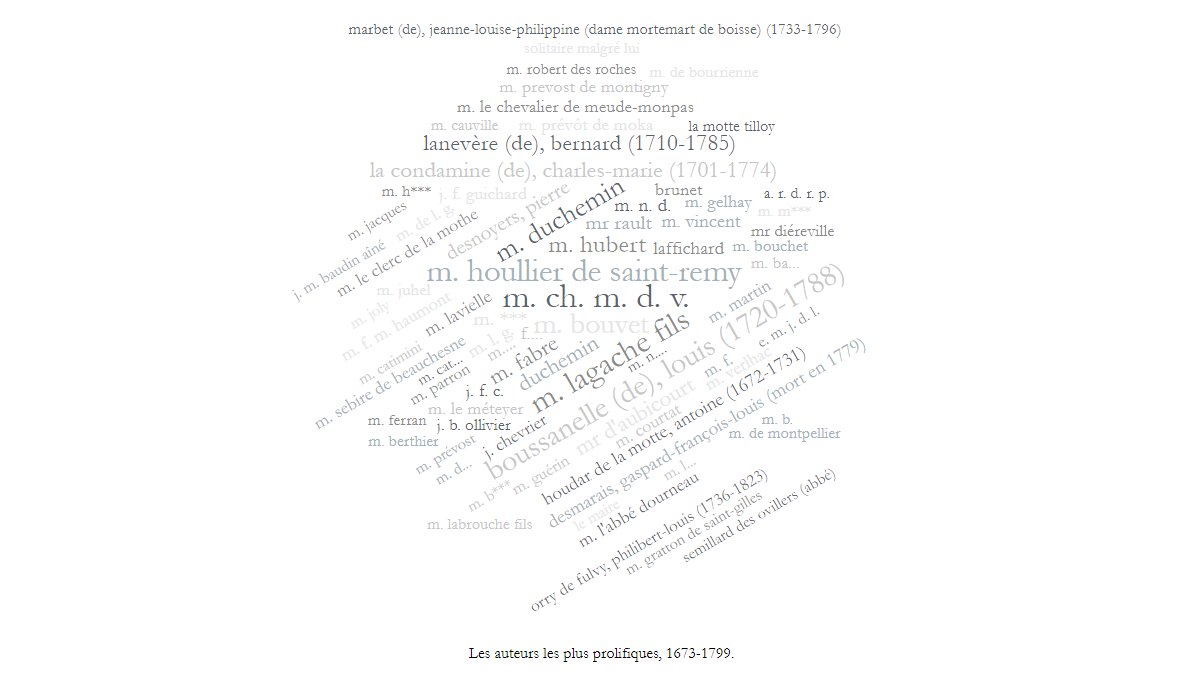
TL: Data visualization helps to provide a more insightful statistical overview of this corpus of texts. It allows us to understand at a glance who the most prolific authors were, where they came from, as well as learn about their professions, the most frequent answers to the riddles, in which periods the most riddles appeared, and so on.
A: So, how do you use AnyChart for data visualization in Les Énigmes de Mercure? What chart types supported in our JavaScript library appeared to be helpful?
TL: I use AnyChart’s elegant word clouds to identify the most popular author names, the most frequent riddle answers, and the prevalent professions of the authors.
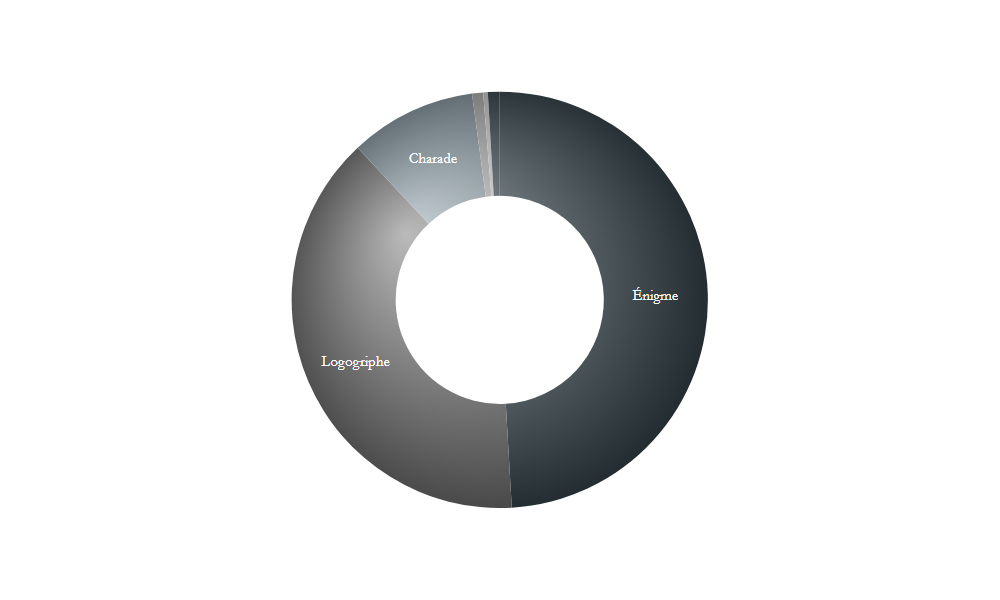
A donut chart allows me to show the proportion of each ludic literary genre within the corpus: enigma, logogriph, charade, chanson, sonnet, and others.
Each chart is interactive. The visitor can click on its elements to send a query to the database and consult the corresponding data set.
A: Please outline some technical details of Les Énigmes de Mercure. What technologies is your web project built on?
TL: My website and its search engine are written mainly in PHP and SQL.
Besides the AnyChart library, I use PDF.js, OpenLayers, and Chart.js. AnyChart and these other JavaScript libraries have all provided me with charts that are perfectly suited to my needs, both in terms of functionality and graphics.

A: Why did you decide to use our JS library for interactive data visualization? What did you like the most?
TL: AnyChart is easy to configure and customize. The online documentation is clear and allows you to quickly obtain the desired charts. I got quick answers to questions I submitted by email.
A: In your opinion, what does AnyChart lack, or what should we improve next?
TL: Well, I have not explored all capabilities of AnyChart yet, so I cannot answer this question exhaustively. From what I’ve experienced and needed so far creating my visualizations, all looks in place.
A: If someone asks you for quick advice on what JavaScript charting library to choose, what would you say recommending AnyChart?
TL: I would emphasize that AnyChart offers a lot of options. Depending on the nature of the project, it alone is likely to cover all the needs of the developer in terms of data graphics, which therefore lets you avoid importing many different libraries.
A: Merci beaucoup, Timothée! All the best!
Check out the Les Énigmes de Mercure case study we’ve just published as well and see other selected case studies.
Read more customer stories in our blog.
If you want to share your AnyChart story, please let us know.
- Categories: AnyChart Charting Component, Big Data, Charts and Art, HTML5, JavaScript, Success Stories
- No Comments »