 DataViz Weekly is here featuring a selection of new compelling projects with awesome charts and maps. Check out some of the coolest fresh examples of data visualization best practices in action!
- $4 trillion coronavirus bailout under the microscope — The Washington Post
- Presidential Plinko — Matthew Kay, Northwestern University
- Allegations of foreign interference in the 2020 U.S. election — DFRLab
- American streets named after athletes — ESPN
Data Visualization Weekly: October 2, 2020 — October 9, 2020
$4 Trillion Coronavirus Bailout Under Microscope
 In response to the coronavirus crisis, the United States Congress has already endorsed $4 trillion worth of government loans, grants, and tax breaks. Totaling even more than the cost of the eighteen-year-long Afghanistan war, this is the most expensive economic relief effort in America’s modern history. Do you know where has the money gone?
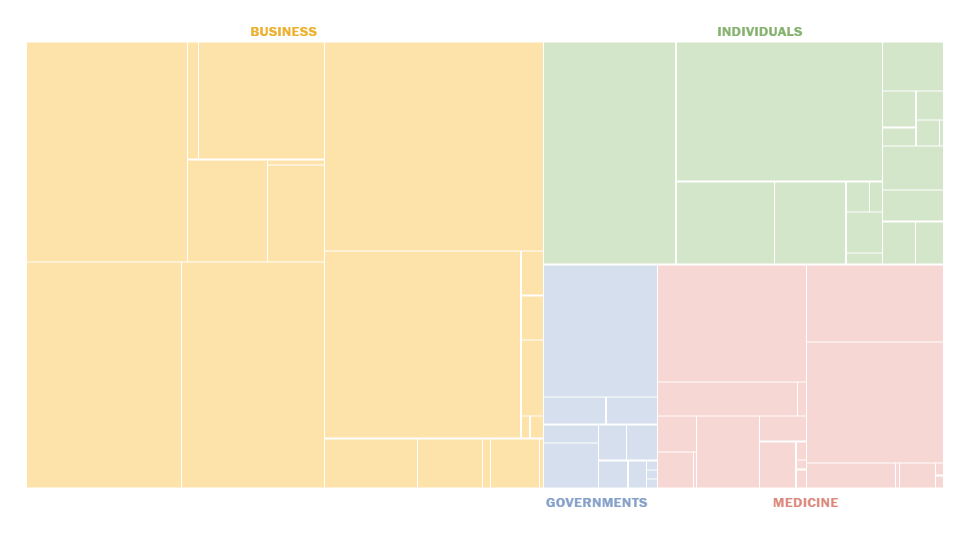
The Washington Post presented the breakdown of the COVID-19 bailout spending with the help of a treemap and scrollytelling. There, we can see that the biggest part, $2.3 trillion, went to businesses. One-fifth, or $884 billion, went to workers and their families. As much (or little?) as 16% were spent on addressing the health crisis, including vaccine development, contact tracing, testing, and other measures. Finally, $253 billion went to state governments and public agencies.
In the piece, just keep scrolling and then explore the interactive treemap chart by hovering around the visualization to see the details. Don’t miss out on the big story right next to the graphical part, where you can learn even more, including why the record-breaking efforts could not bring the American economy to life.
Presidential Plinko
Along with COVID-19, the 2020 U.S. Presidential election is one of the hottest topics on the agenda in America. Who will win, Trump or Biden? We’ve seen a number of forecasts and models based on historical patterns in voting as well as the latest polling data. All those predictions are probabilistic, of course, which means there are always chances of them not being correct at the end. What chances?
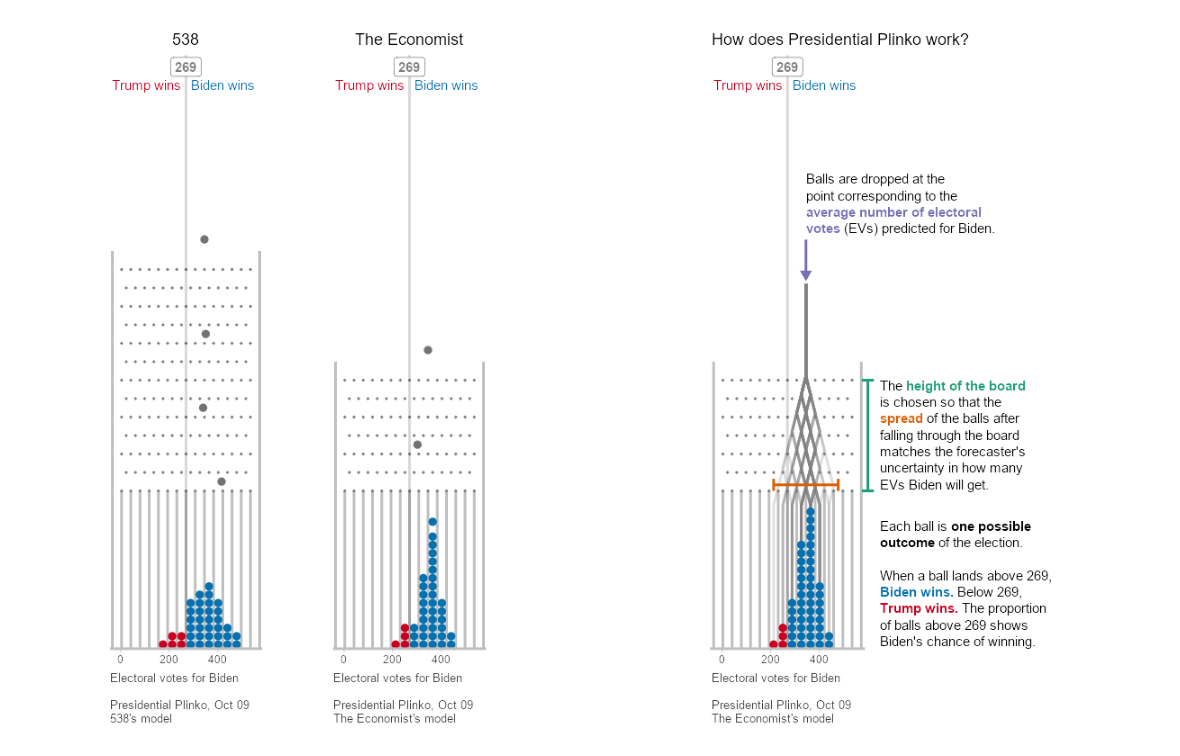
Matthew Kay, Assistant Professor of Computer Science and Communication Studies at Northwestern University, illustrated this uncertainty as virtual Plinko boards for two famous election forecast models, by FiveThirtyEight and The Economist. Look at that. Each board’s height is defined by the corresponding predictive distribution. One ball is one potential outcome of the presidential election in 2020.
Play with the visualization to feel the forecasters’ uncertainty in the election outcome. Try dropping one ball, then several, and then all balls. Cool project.
Allegations of Foreign Interference in 2020 Election
![]()
A lot has been said here and there about foreign interference in the U.S. elections. But which of the statements are credible in reality?
The Atlantic Council’s Digital Forensic Research Lab (DFRLab) launched a special data project that sheds light on this aspect. The newly released Foreign Interference Attribution Tracker, or simply the FIAT, is an interactive open-source tool making it easy to investigate claims of foreign interference in the upcoming election in a visual way through exploring the timeline and map graphics. Credibility, evidence, bias, transparency, and influence are displayed for each case. The project’s database currently includes 74 allegations that originate from 17 countries and more than 14 million social media engagements. The creators promise to add more data and functionality moving forward.
Hover around to look into details. Multiple filtering options will allow you to focus on specific matters you would like to understand. There is a lot to check out and learn about foreign interference attempts on record here. You can also submit new cases for consideration and analysis at the DFRLab.
U.S. Streets Named After Athletes
Many roads all over the United States are named after athletes. Do you know exactly whose fame is cemented with the most streets and where they are located? Or, for example, what sport deserved to have the biggest number of roads across the country named after its athletes?
ESPN conducted a research with the help of data from the 2010 U.S. census, Google Maps, as well as a number of other sources, and created a cool visual story where you can find answers to these and even more questions about athlete streets.
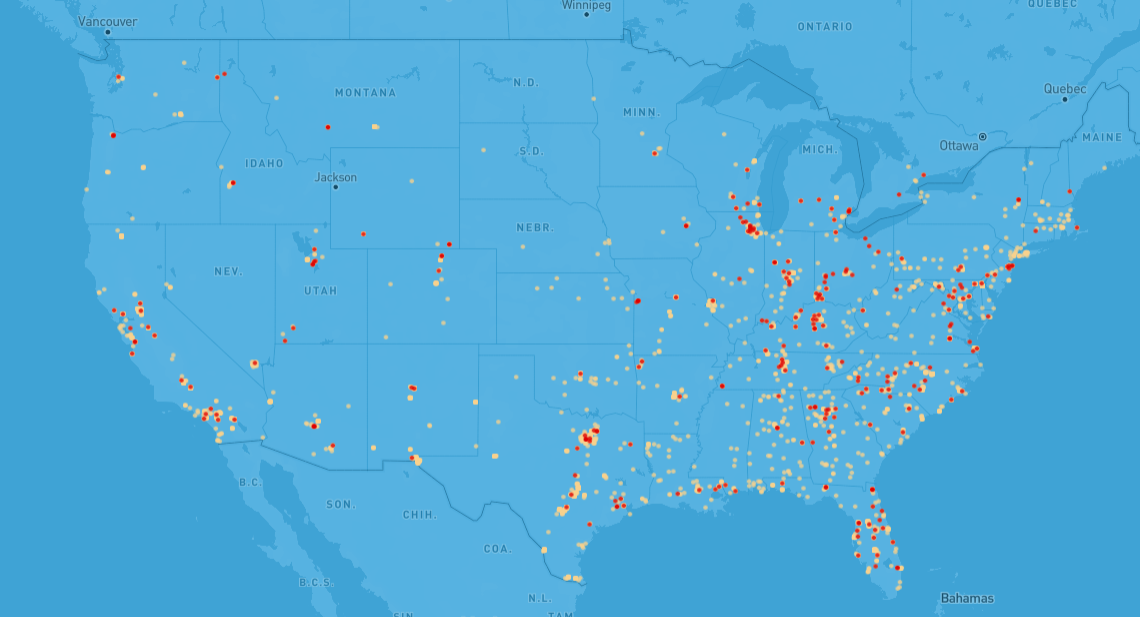
In total, according to ESPN’s findings, there are 3,764 such roads in America. You might be suprised (or not) but Secretariat, a famous racehorse, is the top athlete that has the most streets named after him. There are 263 Secretariat streets around the United States — you can see them colored red on the map above, while the rest of the dots show where all the other athlete streets can be found. He is followed by legendary NASCAR driver Dale Earnhardt (with 101 streets), and another racehorse, Citation (86). And yes, horse racing is by far the leading sport in these terms, with a total of 1,835 streets named after its athletes. Next go golf (777) and baseball (323).
Scroll down the story to learn about other interesting statistics and facts. The U.S. map will accompany you along the entire way to provide insight on where those streets being mentioned are located.
***
We appreciate your attention to our weekly feature. Stay tuned for even more examples of the best data visualization practices in action. Follow us on social media and feel free to ping us whenever you create or come across a cool data viz: LinkedIn, Facebook, Twitter, Medium, Pinterest.
- Categories: Data Visualization Weekly
- No Comments »