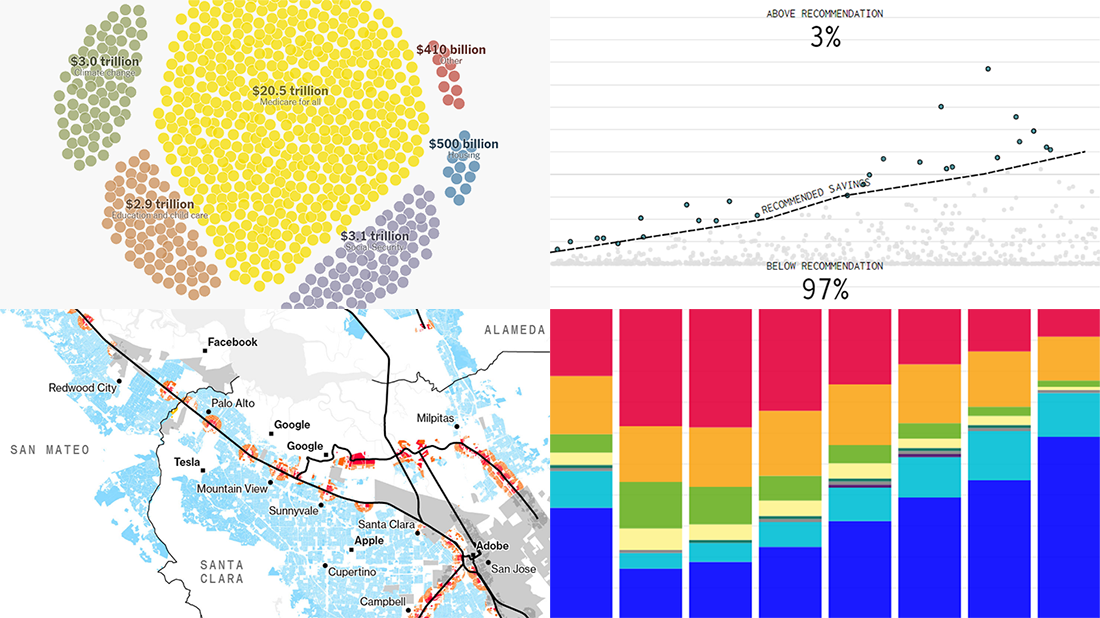
 It’s Friday, which means we are ready to share with you new awesome examples of charting in action. Look how powerful the right visualization can be when one needs to explore or communicate various statistics. Here’s a quick list of the projects presented in this new DataViz Weekly post — we’ve found them out there these days:
- Saving for retirement in the United States — FlowingData
- Costs of Elizabeth Warren’s policy plans — The New York Times
- Housing crisis in California — Bloomberg
- Voting intentions before the 2019 United Kingdom general election — CNBC
Examples of Great Charting in Data Visualization Weekly: November 8, 2019 — November 15, 2019
Saving for Retirement in America
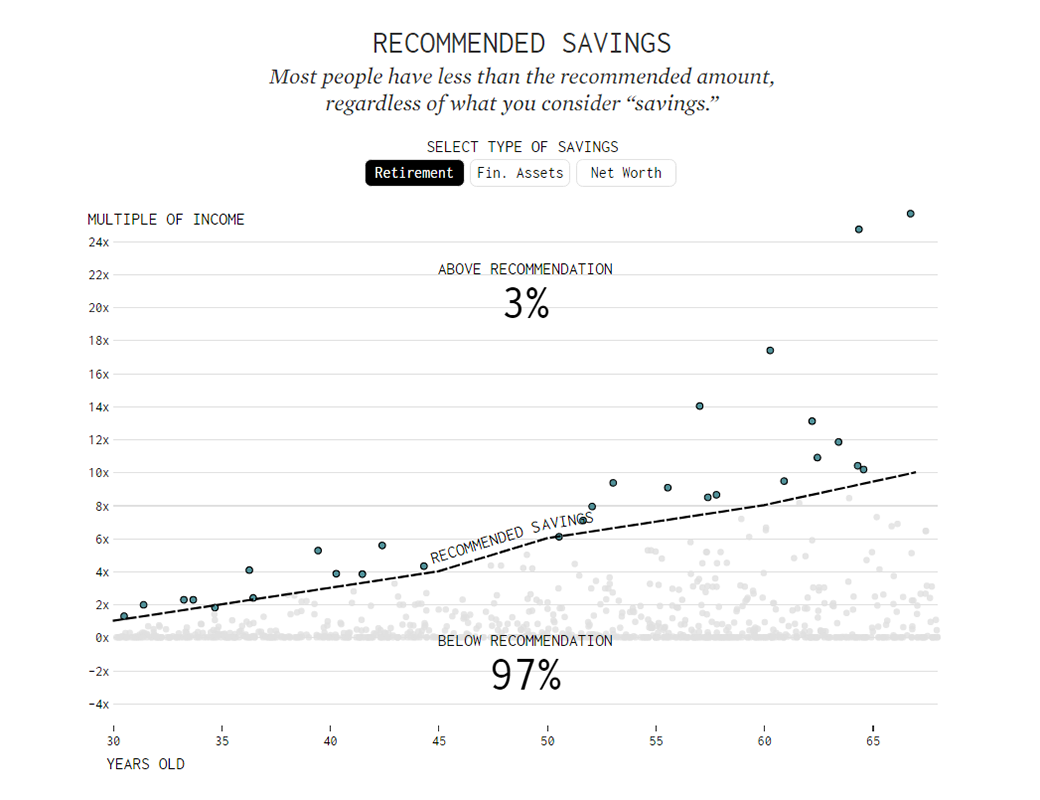
Statistician Nathan Yau continued to research into the topic of savings for retirement in the United States. In his earlier project that we featured in DataViz Weekly two weeks ago, he took a look at how assets, debt, and net worth change with age to find out at what moment in life Americans reach $100,000 in savings. This week, Nathan decided to identify how much money U.S. people actually save over time.
For the new work, he again turned to data from the Federal Reserve Board’s Survey of Consumer Finances (SCF) as the main source. Look at the charts showing how much savings grow with age, including separate views for retirement accounts, financial assets, and net worth. The first visualization displays the absolute values. The second one shows savings as a multiple of income. The third chart integrates Fidelity’s data regarding the saving recommendations.
Costs of Elizabeth Warren’s Policy Plans
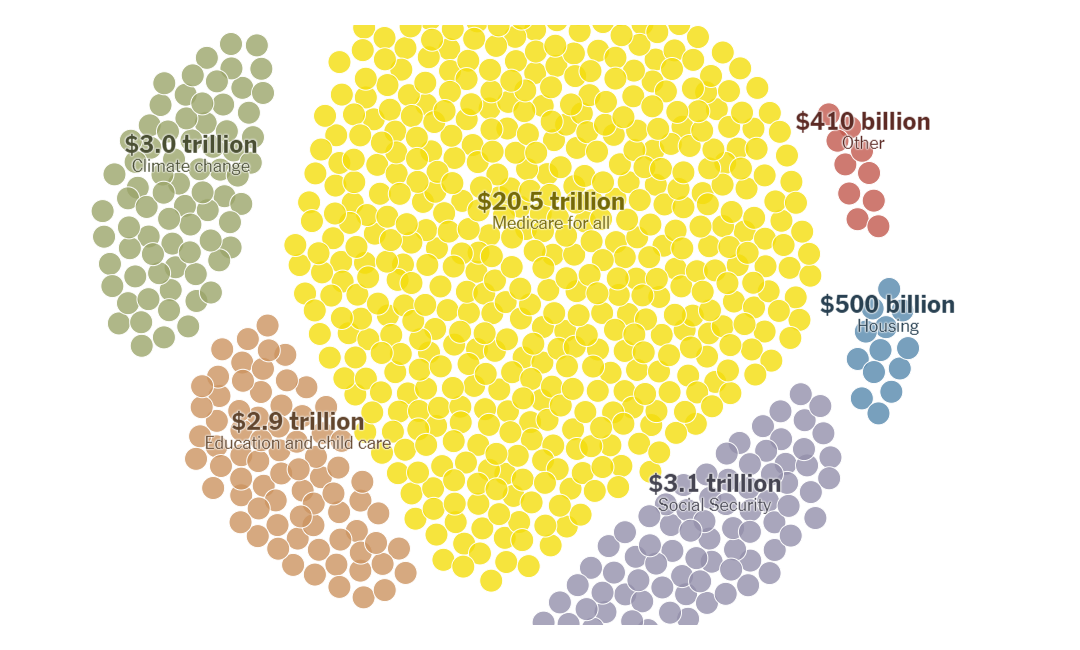
Monumental policy plans voiced by U.S. Senator Elizabeth Ann Warren, running for president in the 2020 election, appear to be as ambitious as expensive. According to experts, they would cost the federal government more than $30 trillion during a decade.
Join The New York Times as the newspaper provides a breakdown of these costs. Beautiful data visualizations from the NYT Graphics team greatly adds up to the story, facilitating and enhancing the reader’s experience while delving into the financial details. Each dot on the graphics stands for $40 billion in Ms. Warren’s planned spending.
California Housing Crisis
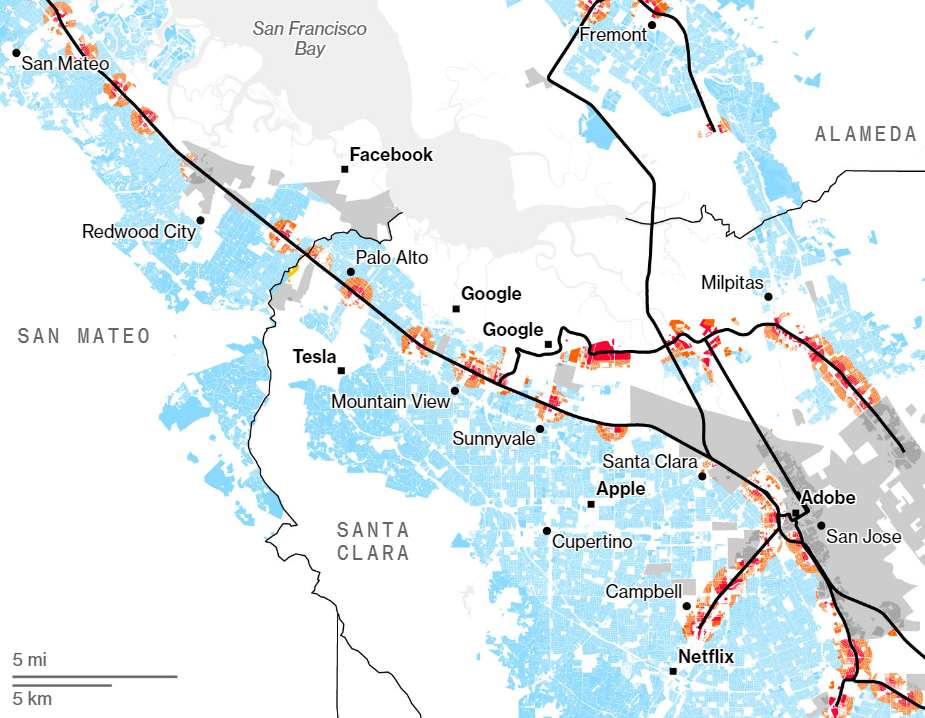
California is likely to be unable to build enough new homes. Wildfires have only worsened the situation. As a result, the median price for a house currently exceeds $600,000 which is already more than two times higher than the national level and counting. At the same time, poverty rates here are the worst across the United States.
Calling California “America’s worst housing nightmare,” Bloomberg provides a look at how this “place known for diversity, innovation and quality of life” has gotten here. Check out a number of awesome charts and maps that provide a closer look at the housing crisis in California.
Voting Intentions Before UK General Election
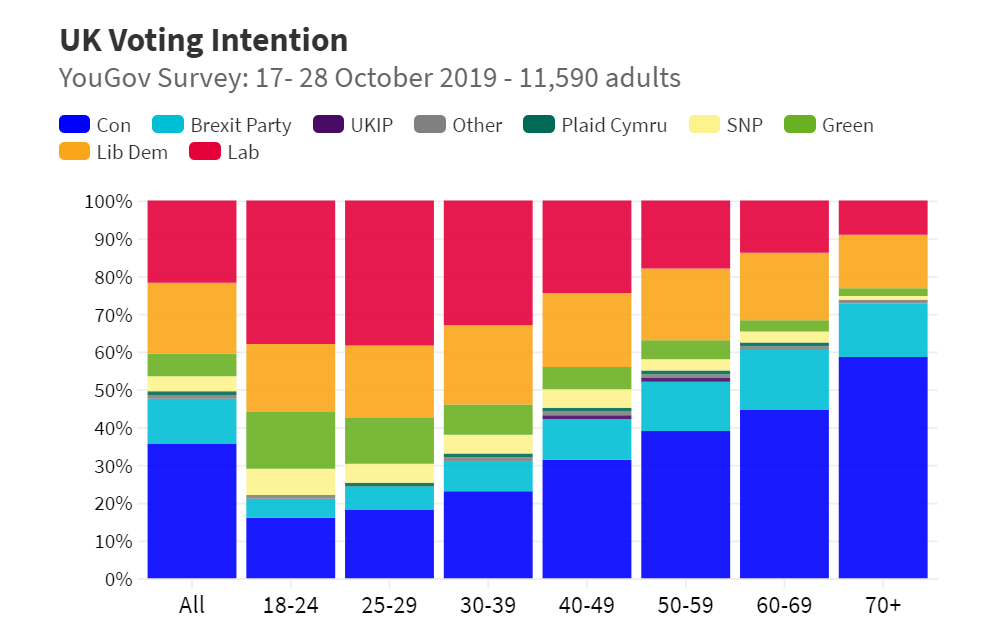
The Early Parliamentary General Election Act 2019 made legal provision for organizing the 2019 United Kingdom general election on December 12. Just a few weeks prior to the snap election, when the British political parties’ campaigns are in full swing, CNBC found it interesting to explore the voting intentions in the country.
To visualize what is called “a portrait of British political opinion,” CNBC used data from a recent YouGov survey. Look at the charting pieces they made. The visualizations show how the public vote can be currently split down by party, age, and educational level.
***
We hope you like these four projects making great use of charting. We’ll keep you posted on new ones. Stay tuned for Data Visualization Weekly.
- Categories: Data Visualization Weekly
- No Comments »