Use a JavaScript library to create a Gantt chart and take your project management efforts to the next level.
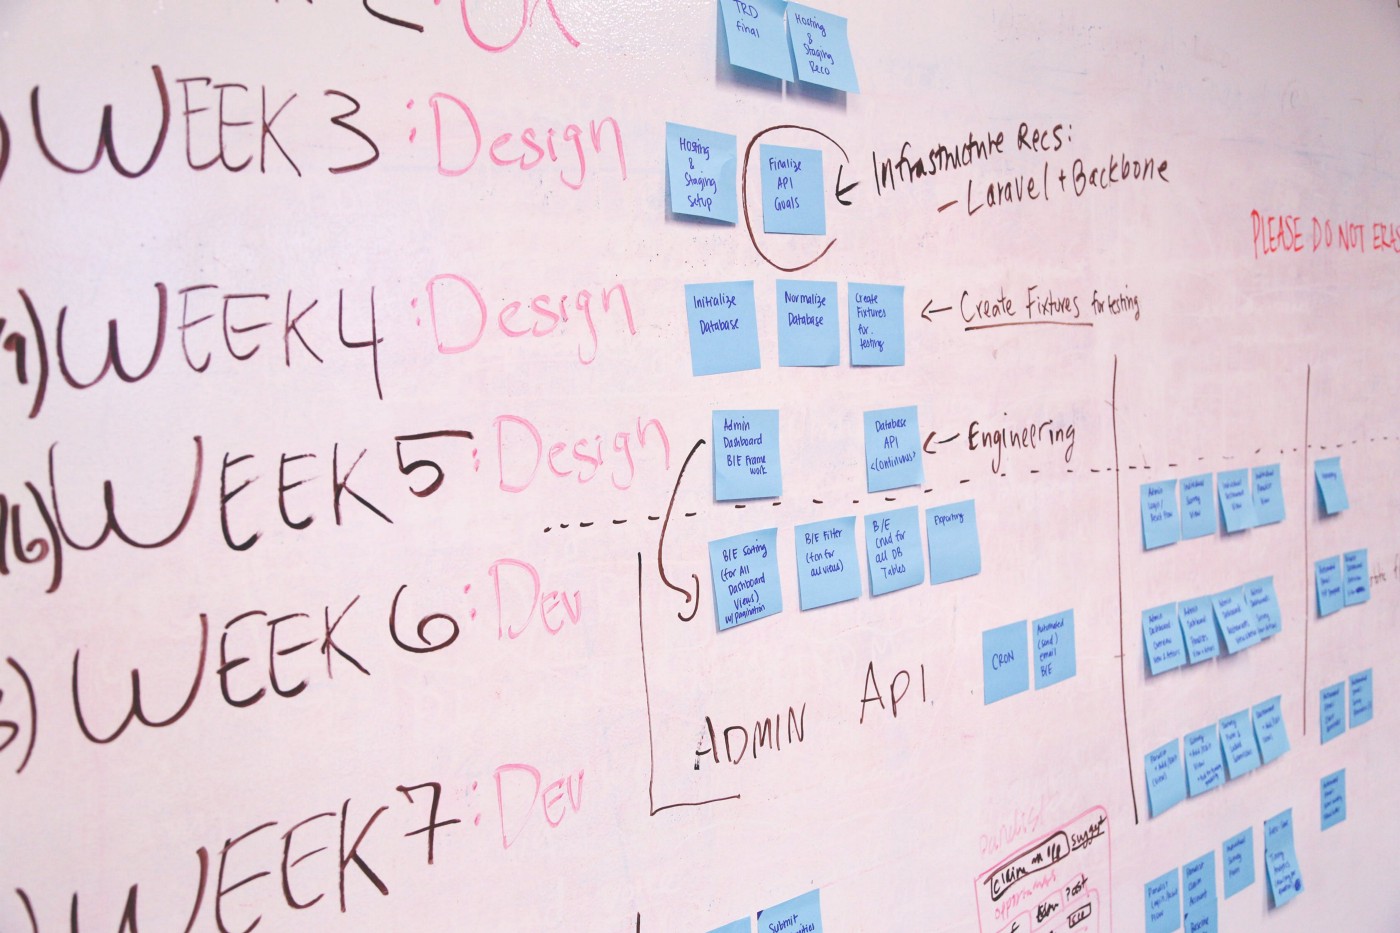
Earlier this year, my team was looking for a project management tool that could assist us in charting the various tasks related to our app development project against some specific timelines. After doing some research, we finally settled on Gantt charts. However, some people think Gantts are complicated to create. Not true! Thanks to numerous JavaScript chart libraries, data visualization is now simple, flexible, and embeddable.
In our situation, we settled on AnyChart’s JS Charts library because of its ease of use, extensive documentation, flexible code playground for trying out stuff, and other powerful features.
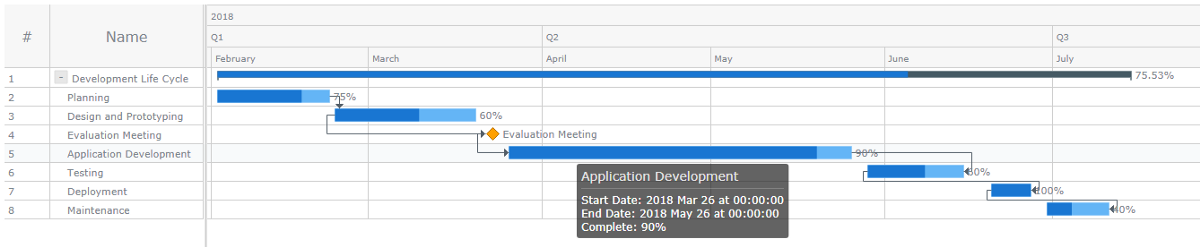
In this tutorial, I’ll walk you through how to create a simple interactive Gantt chart using this data visualization library. Here’s what we’ll be making and you can get the entire code for creating such a Gantt chart at the end of the tutorial:
Creating a JS Gantt chart in 4 steps
Let’s get our hands dirty and use the JavaScript library to create a simple Gantt chart for scheduling and monitoring project activities.
In this JS charting tutorial, we’ll follow these four steps:
- Step 1: Preparing the data
- Step 2: Getting dependencies
- Step 3: Declaring the chart container
- Step 4: Rendering the Gantt chart
Step 1: Preparing the data
The first step in building a Gantt chart using JavaScript is to prepare the data that will be displayed. The AnyChart library requires data to be represented using the tree data model.
In this model, the data is organized as a hierarchical tree-like structure in which parent-child relationships are used to connect the various data items.
As such, the parent data item will have a children data field in which the child items are stated as an array.
Let me show you an example of what I’m talking about:
var data = [{
	id: "1",
	name: "Development Life Cycle",
	actualStart: Date.UTC(2018, 01, 02),
	actualEnd: Date.UTC(2018, 06, 15),
	children: [{
			id: "1_1",
			name: "Planning",
			actualStart: Date.UTC(2018, 01, 02),
			actualEnd: Date.UTC(2018, 01, 22),
			connectTo: "1_2",
			connectorType: "finish-start",
			progressValue: "75%"
		},
		// more data goes here
	]
}];
Step 2: Getting dependencies
AnyChart utilizes a minimalist, modular-based approach that lets you get only those dependencies that are essential for your project, which greatly shrinks the size of the deployed code, leading to enhanced performance.
For creating the Gantt chart, we’ll add the following Core and Gantt modules in the <head> section of our web page.
<head>
<script src="https://cdn.anychart.com/releases/8.6.0/js/anychart-core.min.js"></script>
<script src ="https://cdn.anychart.com/releases/8.6.0/js/anychart-gantt.min.js"></script>
</head>
Step 3: Declaring the chart container
Then, let’s create a container where the Gantt chart will load to.
<body>
<div id="container"></div>
<body>
Notice that I’ve given the <div> element and id of “container” to be referenced in the next step.
Step 4: Rendering the Gantt chart
Lastly, we’ll follow these steps to render the Gantt chart:
Create the data tree by passing the prepared data to the anychart.data.tree() method. For the second parameter, we’ll specify it as “as-tree”.
var treeData = anychart.data.tree(data, "as-tree");Create the project Gantt chart by calling the anychart.ganttProject() chart constructor:
var chart = anychart.ganttProject();Set the data by passing the created data tree to the chart’s data() method:
chart.data(treeData);Configure the timeline’s scale up to the date that the project will end:
chart.getTimeline().scale().maximum(Date.UTC(2018, 06, 30));Reference the chart container id we’d set previously:
chart.container("container");Initiate drawing the chart:
chart.draw();Fitt the specified activities within the width of the timeline:
chart.fitAll();Here is the entire code I used for creating the Gantt chart on the picture above:
(You can also view the code here).
<html>
<head>
<script src="https://cdn.anychart.com/releases/8.6.0/js/anychart-core.min.js"></script>
<script src ="https://cdn.anychart.com/releases/8.6.0/js/anychart-gantt.min.js"></script>
</head>
<body>
<div id = "container" ></div>
<script>
anychart.onDocumentReady(function () {
	// create data
	var data = [{
		id: "1",
		name: "Development Life Cycle",
		actualStart: Date.UTC(2018, 01, 02),
		actualEnd: Date.UTC(2018, 06, 15),
		children: [{
				id: "1_1",
				name: "Planning",
				actualStart: Date.UTC(2018, 01, 02),
				actualEnd: Date.UTC(2018, 01, 22),
				connectTo: "1_2",
				connectorType: "finish-start",
				progressValue: "75%"
			},
			{
				id: "1_2",
				name: "Design and Prototyping",
				actualStart: Date.UTC(2018, 01, 23),
				actualEnd: Date.UTC(2018, 02, 20),
				connectTo: "1_3",
				connectorType: "start-start",
				progressValue: "60%"
			},
			{
				id: "1_3",
				name: "Evaluation Meeting",
				actualStart: Date.UTC(2018, 02, 23),
				actualEnd: Date.UTC(2018, 02, 23),
				connectTo: "1_4",
				connectorType: "start-start",
				progressValue: "80%"
			},
			{
				id: "1_4",
				name: "Application Development",
				actualStart: Date.UTC(2018, 02, 26),
				actualEnd: Date.UTC(2018, 04, 26),
				connectTo: "1_5",
				connectorType: "finish-finish",
				progressValue: "90%"
			},
			{
				id: "1_5",
				name: "Testing",
				actualStart: Date.UTC(2018, 04, 29),
				actualEnd: Date.UTC(2018, 05, 15),
				connectTo: "1_6",
				connectorType: "start-finish",
				progressValue: "60%"
			},
			{
				id: "1_6",
				name: "Deployment",
				actualStart: Date.UTC(2018, 05, 20),
				actualEnd: Date.UTC(2018, 05, 27),
				connectTo: "1_7",
				connectorType: "start-finish",
				progressValue: "100%"
			},
			{
				id: "1_7",
				name: "Maintenance",
				actualStart: Date.UTC(2018, 05, 30),
				actualEnd: Date.UTC(2018, 06, 11),
				progressValue: "40%"
			},

		]
	}];
	// create a data tree
	var treeData = anychart.data.tree(data, "as-tree");

	// create a chart
	var chart = anychart.ganttProject();

	// set the data
	chart.data(treeData);
	// configure the scale
	chart.getTimeline().scale().maximum(Date.UTC(2018, 06, 30));
	// set the container id
	chart.container("container");
	// initiate drawing the chart
	chart.draw();
	// fit elements to the width of the timeline
	chart.fitAll();
});
</script>
</body>
</html>
Customizing the Gantt chart design
AnyChart provides a wide range of options to customize the design of data visualizations to suit your individual preferences and needs. In the data fields, you can set various attributes to customize the look and feel of your Gantt chart.
For example, here are some data fields I specified in the above Gantt chart example:
id— sets the unique identifier of every task;name— sets the name of every task;actualStart— sets the start date of every task;actualEnd— sets the end date of every task;connectTo— is a type of connector that sets the target task;connectorType— sets the type of connector, which can be “start-start,” “start-finish,” “finish-start,” or “finish-finish”;progressValue— sets the progress value of every task as a percentage.
Furthermore, AnyChart allows the following types of tasks, which can be visualized in different ways:
- regular tasks — do not have relationships with other tasks;
- parent tasks — have parent-child relationships with other tasks;
- milestones — visualize events with zero duration. They can be specified by setting the same date on the
actualStartandactualEndfields.
Loading data as a table
If you want to create a chart by loading data from a relational database, you can organize the data as a table with parent/child links.
In that case, the parent field of every item should have the id value of its parent specified. Also, you should set the parent of a root item to null, or just fail to specify it.
Here is what I’m talking about:
(You can also view the code here).
var data = [{
		id: 1,
		parent: null,
		name: "Root",
		actualStart: Date.UTC(2018, 01, 02),
		actualEnd: Date.UTC(2018, 06, 15),
	},
	{
		id: 2,
		parent: 1,
		name: "Parent 1",
		actualStart: Date.UTC(2018, 01, 02),
		actualEnd: Date.UTC(2018, 01, 22),
		progressValue: "90%"
	},
	{
		id: 3,
		parent: 2,
		name: "Child 1–1",
		actualStart: Date.UTC(2018, 01, 23),
		actualEnd: Date.UTC(2018, 02, 20),
		progressValue: "75%"
	},
	{
		id: 4,
		parent: 2,
		name: "Child 1–2",
		actualStart: Date.UTC(2018, 02, 23),
		actualEnd: Date.UTC(2018, 02, 23),
		progressValue: "60%"
	},
	{
		id: 5,
		parent: 1,
		name: "Parent 2",
		actualStart: Date.UTC(2018, 02, 26),
		actualEnd: Date.UTC(2018, 04, 26),
		progressValue: "80%"
	},
	{
		id: 7,
		parent: 5,
		name: "Child 2–1",
		actualStart: Date.UTC(2018, 04, 29),
		actualEnd: Date.UTC(2018, 05, 15),
		progressValue: "30%"
	},
];
Also, when you load data as a table, don’t forget to change the second parameter in the anychart.data.tree() method from “as-tree” to “as-table”, so the whole line looks as follows:
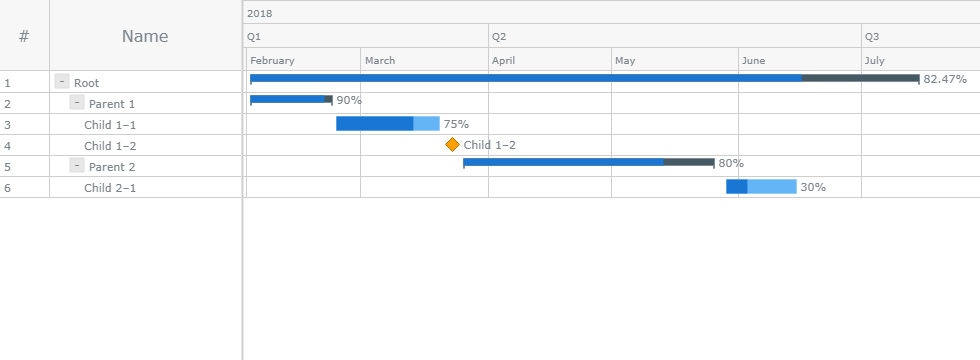
var treeData = anychart.data.tree(data, "as-table");Here is a screenshot of the Gantt chart created when data is loaded as a table:
Conclusion
That’s it!
As you can see, creating a Gantt chart using the AnyChart JavaScript charting library is simple and straightforward.
In this tutorial, I’ve just scratched the surface about what you can accomplish with Gantt charts. I hope you’ve learnt the amazing capabilities of this type of chart and how it can assist you in managing your web development tasks.
Of course, you can have a look at the easy to follow AnyChart’s Gantt chart documentation to learn more ways of tweaking the Gantt chart to fit your design requirements and assist you in tracking your project management activities.
All the best.
The “Create Simple Gantt Chart Using JavaScript — Tutorial” article is published on the AnyChart blog with permission of Alfrick Opidi.
Originally appeared on Towards Data Science under the title “How to Create a Simple Gantt Chart Using JavaScript” on August 28, 2019.
- Categories: AnyChart Charting Component, AnyGantt, Big Data, Business Intelligence, Gantt Chart, HTML5, JavaScript, JavaScript Chart Tutorials, Tips and Tricks
- 3 Comments »
Comments (3)
This is a nice tutorial, easy to follow.
One gotcha I ran into is that any year data greater 2018 is not supported.
Surely it is supported, it is just set to be limited in this particular sample in line 61:
chart.getTimeline().scale().maximum(Date.UTC(2018, 06, 30));
If you set it to chart.getTimeline().scale().maximum(Date.UTC(2058, 06, 30)); or omit altogether – you will get where you need to.
Fork with 2058 https://playground.anychart.com/8nXtJOKq
Fork without limiting https://playground.anychart.com/94ft7Zmu
You can play with timeline settings when big periods are in play too