 Web developer Alfrick Opidi shows how to create beautiful interactive bar charts using JavaScript (HTML5), taking the AnyChart JS charting library as an example along the tutorial.
Data visualization is an important concept that is used to assist audiences in understanding complex ideas easily, identifying patterns and trends quickly, and making the most of the presented data. With the current proliferation of data generation, finding ways of extracting, cleaning, and visualizing data to enable easier interpretation is increasingly on demand.
Furthermore, if data visualization is accompanied with interactive capabilities, the audience can drill down to the finer details of the charts, graphs, maps, and dashboards and retrieve useful analysis and insights.
In the world of JavaScript programming, there are several charting libraries that allow developers to create stunning charts and visualize data without much hassle. Whether you require an open sourced library, paid-for library, or any other type, you can find something to take your data visualization efforts to the next level.
Some of the best JavaScript charting libraries include Google Charts, AnyChart, D3, and Highcharts. Basically, the process of creating interactive charts with any of them tends to be quite similar. So, once you’ve mastered how to use one, you can easily extrapolate the process to the other libraries, especially if you need a unique feature present in any of them.
For this JS chart tutorial, we’ll use examples from AnyChart. It’s a flexible and easy to use HTML5 JavaScript charting library that comes with exhaustive documentation, an extensive variety of supported chart types, code playground to test out things, and lots of other interesting features.
Now, let’s start getting our hands dirty and see how AnyChart can assist in meeting our data visualization needs.
How to Create Simple JS Bar Chart in 3 Steps
Here are three simple steps you can use to create a basic chart in JavaScript and integrate it into your website or application.
- Prepare the data.
- Connect to a JS charts library.
- Write some code.
Now, let’s talk about each of the steps.
1. Preparing the Data
If you have unstructured data, you need to prepare it for easier loading into the charting library. Depending on the library you choose, you’ll need to prepare the data in the format it accepts. In the case of AnyChart, it supports a wide range of data formats, including Google Spreadsheet, XML, CSV, HTML, and JSON.
When creating most charts, you just need to provide the values for the X and Y axes. Creating bar charts is even simpler because you only need to provide values for the Y-axis, and an index number or an item number will be taken to represent the X-axis values.
For example, if we prepare the data in an array format, X will be the item numbers and Y will be the data values.
var data = [120, 60, 30, 80, 50];
   // X is item numbers [0,1,2,3,4,5]
   // Y is the data values
Also, if the data is available in JSON format, it could look like the following
[{
        'x': Item One',
        'value': 120
    },{
        'x': 'Item Two',
        'value': 60
    }...]
2. Connecting to a Charting Library
To connect to your preferred JavaScript charting library, you can choose to download the relevant package and store it locally or use a CDN service. A CDN is usually recommended because it allows you to load the library’s files from the server closest to your audience, which provides quick page load speeds and enhanced performance.
AnyChart uses a modular-based system that enables you to connect only the chart types and features you need in your project, considerably shrinking the size of the code running on our application.
For example, if we want to create a bar chart using AnyChart JS, we’ll need to add the following Core and basic Cartesian modules:
<script src="https://cdn.anychart.com/releases/v8/js/anychart-core.min.js"></script>
<script src="https://cdn.anychart.com/releases/v8/js/anychart-cartesian.min.js"></script>
3. Writing Some Code
Now, here are the steps to follow to write some code for creating a basic JS bar chart.
a. We’ll begin by creating a container on the HTML page that will reference the bar chart.
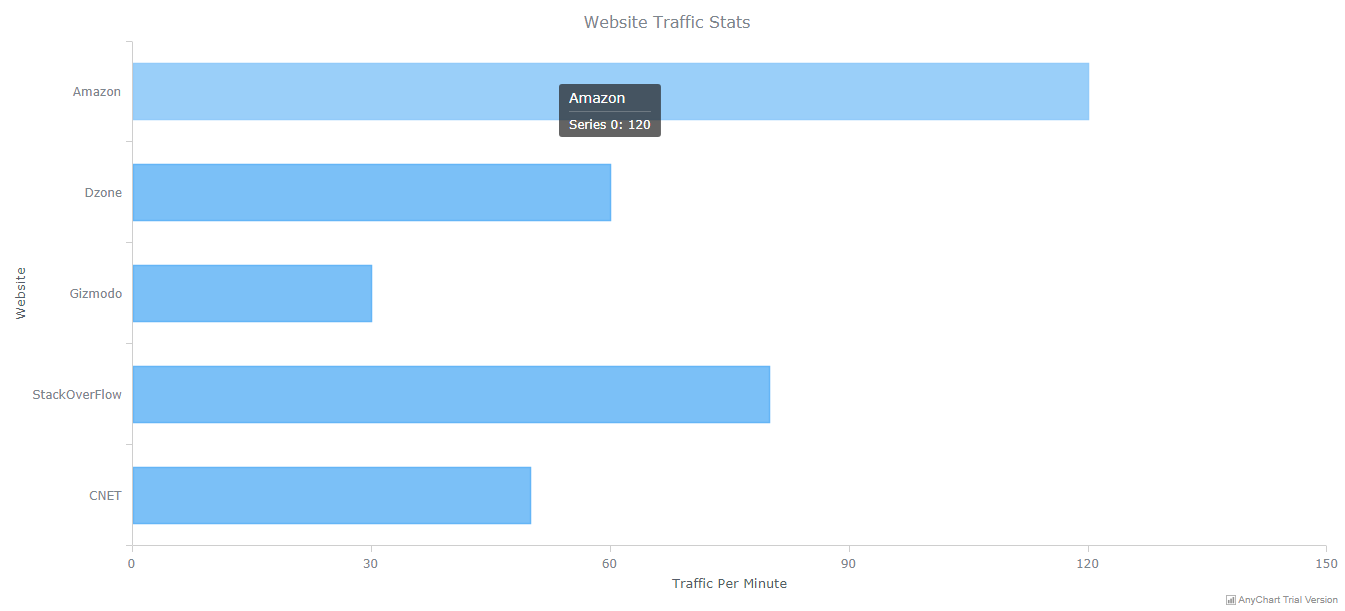
<div id="container"></div>b. Then, let’s include the data we prepared (note that the data is comprised of arbitrary values of the web traffic that some websites receive per minute).
var data = [
        {x: 'Amazon', y: 120},
        {x: 'DZone', y: 60},
        {x: 'Gizmodo', y: 30},
        {x: 'StackOverFlow', y: 80},
        {x: 'CNET', y: 50}
    ];
c. Next, let’s define the type of chart we want to create by calling the applicable chart constructor function.
var chart = anychart.bar();d. Let’s set the title for the chart and the axes.
chart.title('Website Traffic Stats');
chart.xAxis().title("Website");
chart.yAxis().title("Traffic Per Minute");
e. Let’s create a bar series and pass the data.
var series = chart.bar(data);f. Let’s point the chart to the container id we created.
chart.container("container");g. Let’s initiate drawing the bar chart.
chart.draw();Here’s how the chart looks on a browser:
Here is the entire code for creating a basic bar chart using the AnyChart JavaScript library:
<html>
<head>
<script src="https://cdn.anychart.com/releases/v8/js/anychart-core.min.js"></script>
<script src="https://cdn.anychart.com/releases/v8/js/anychart-cartesian.min.js"></script>
</head>
<body>
<div id="container">
<script>
anychart.onDocumentLoad(function() {
// create the data
var data = [
        {x: 'Amazon', y: 120},
        {x: 'DZone', y: 60},
        {x: 'Gizmodo', y: 30},
        {x: 'StackOverFlow', y: 80},
        {x: 'CNET', y: 50}
    ];
var chart = anychart.bar(); // create a chart
chart.title('Website Traffic Stats'); // create title for the chart
chart.xAxis().title("Website"); // create name for X axis
chart.yAxis().title("Traffic Per Minute"); // create name for Y axis
var series = chart.bar(data); // create bar series and pass data
chart.container("container"); // reference the container Id
chart.draw(); // initiate drawing the bar chart
  });

</script>
</div>
</body>
</html>
That’s it!
As you can see, using the AnyChart library for creating beautiful charts is easy and straightforward.
Now, let’s talk about how to enhance the look and feel of the charts using some more advanced steps.
How to Create Advanced JavaScript Bar Charts
Since we already know how to create a bar chart using AnyChart, let’s see what else is possible in case we have a bit more sophisticated data visualization tasks to perform. You’ll see that JavaScript charting is not a rocket science for web developers.
For example, here are some advanced out-of-the-box capabilities you can make use of in the same library.
1. Creating Multi-Series Bar Charts
Apart from the single-series bar chart we built before, you can use AnyChart JS to create a multi-series bar chart that showcases multiple sets of data on the chart’s plot. In AnyChart, a series refers to a single data set that can be displayed on a chart’s plot. With a multi-series chart, you can visualize detailed information and assist your audience in deriving more insights from the data.
For example, let’s say the data is present in an HTML table (check below for the table’s code).
Here’s how the table looks on a browser:

To use the AnyChart JS library to build a multi-series bar chart out of the data, we’ll first need to include the Data Adapter module that assists in loading the HTML data into our work environment.
<script src="https://cdn.anychart.com/releases/v8/js/anychart-data-adapter.min.js"></script>Next, we’ll need to parse the data from the HTML table.
var dataTable = anychart.data.parseHtmlTable('#dataTable');Then, we’ll create a chart and also specify the source of the data.
var chart = anychart.bar();
chart.data(dataTable);
We can also add a legend to the bar chart and enable readers to easily read and understand the meaning of the various values.
var legend = chart.legend();
legend.enabled(true); // enable legend
If we run the code, we’ll get a multi-series bar chart that displays the composition of every value, allowing for easy comparison and understanding of the data.

Here is the entire code for creating a JavaScript-based multi-series bar chart:
<html>
<head>
<script src="https://cdn.anychart.com/releases/v8/js/anychart-core.min.js"></script>
<script src="https://cdn.anychart.com/releases/v8/js/anychart-cartesian.min.js"></script>
<script src="https://cdn.anychart.com/releases/v8/js/anychart-data-adapter.min.js"></script>
</head>
<body>
<div id="container">
<table id="dataTable" border="1">
      <caption>Website Traffic</caption>
      <thead>
        <tr>
          <th>Websites / Traffic Source</th>
          <th>Organic</th>
          <th>Direct</th>
          <th>Referral</th>
        </tr>
      </thead>
      <tbody>
        <tr>
          <td>Amazon</td>
          <td>60</td>
          <td>50</td>
          <td>10</td>
        </tr>
        <tr>
          <td>Dzone</td>
          <td>30</td>
          <td>20</td>
          <td>10</td>
        </tr>
        <tr>
          <td>Gizmodo</td>
          <td>20</td>
          <td>5</td>
          <td>5</td>
        </tr>
        <tr>
          <td>StackOverFlow</td>
          <td>40</td>
          <td>30</td>
          <td>10</td>
        </tr>
        <tr>
          <td>CNET</td>
          <td>25</td>
          <td>5</td>
          <td>20</td>
        </tr>
      </tbody>
</table>
</div>
<script>
anychart.onDocumentLoad(function() {
var dataTable = anychart.data.parseHtmlTable('#dataTable'); // parse data from HTML table
var chart = anychart.bar(); // create chart

chart.xAxis().title("Website"); // create name for X axis
chart.yAxis().title("Traffic Per Minute"); // create name for Y axis
chart.data(dataTable); // specify data source

var legend = chart.legend();

legend.enabled(true); // enable legend
chart.container("container"); // reference the container Id
chart.draw(); // initiate drawing the bar chart
});

</script>
</body>
</html>
2. Creating Stacked Bar Charts
You can create a stacked bar chart on the fly without making extensive changes to the multi-series bar chart. AnyChart has two ways of stacking charts: value stacking and percent stacking. You can choose one of these values by setting the scale of the stackMode method to “value” and “percent” respectively.
Here’s how to set the stackMode for a value-based JS stacked bar chart:
chart.yScale().stackMode('value');Here’s the result:

Here’s how to set the mode for a 100% stacked bar chart:
chart.yScale().stackMode('percent');Here’s the result:

3. Adding Interactivity to Charts
By default, JS charts created using the AnyChart library are interactive. Some of the default chart behaviors include highlighting series and points when hovered over, showing tooltips of hovered points, highlighting a series when its respective legend is hovered over, showing or hiding a series when its respective legend item is clicked on, etc.
Furthermore, you can modify the charts’ default interactivity to suit your needs and preferences. For example, we can configure the tooltip in the 100% stacked bar chart we’ve just built to give more information every time a user hovers to a point on the bar chart.
chart.tooltip().title("Traffic Data");
chart.tooltip().format("Website: {%categoryName} \n{%seriesName}: {%value}");
Here’s the result:

Here’s the entire code for creating this JS chart with added interactivity:
<html>
<head>
<script src="https://cdn.anychart.com/releases/v8/js/anychart-core.min.js"></script>
<script src="https://cdn.anychart.com/releases/v8/js/anychart-cartesian.min.js"></script>
<script src="https://cdn.anychart.com/releases/v8/js/anychart-data-adapter.min.js"></script>
</head>
<body>
<div id="container">
<table id="dataTable" border="1">
      <caption>Website Traffic</caption>
      <thead>
        <tr>
          <th>Websites / Traffic Source</th>
          <th>Organic</th>
          <th>Direct</th>
          <th>Referral</th>
        </tr>
      </thead>
      <tbody>
        <tr>
          <td>Amazon</td>
          <td>60</td>
          <td>50</td>
          <td>10</td>
        </tr>
        <tr>
          <td>Dzone</td>
          <td>30</td>
          <td>20</td>
          <td>10</td>
        </tr>
        <tr>
          <td>Gizmodo</td>
          <td>>20</td>
          <td>5</td>
          <td>5</td>
        </tr>
        <tr>
          <td>StackOverFlow</td>
          <td>40</td>
          <td>30</td>
          <td>10</td>
        </tr>
        <tr>
          <td>CNET</td>
          <td>25</td>
          <td>5</td>
          <td>20</td>
        </tr>
      </tbody>
    </table>
<script>
anychart.onDocumentLoad(function() {
var dataTable = anychart.data.parseHtmlTable('#dataTable'); // parse data from HTML table
var chart = anychart.bar(); // create chart

chart.xAxis().title("Website"); // create name for X axis
chart.yAxis().title("Traffic Per Minute"); // create name for Y axis
chart.data(dataTable); // specify data source
chart.yScale().stackMode('percent'); // setting percent stacking

var legend = chart.legend();

legend.enabled(true); // enable legend
chart.tooltip().title("Traffic Data"); // configuring the tooltip
chart.tooltip().format("Website: {%categoryName} \n{%seriesName}: {%value}");
chart.container("container"); // reference the container Id
chart.draw(); // initiate drawing the bar chart
});

</script>
</div>
</body>
</html>
Wrapping Up
As you can see, creating versatile and interactive JavaScript (HTML5) charts is easy with a good JS library. In this tutorial, we’ve just scratched the surface of what you can accomplish.
You can go to AnyChart’s documentation and learn how to create other amazing charts and elevate your data visualization expertise.
You can use the skills learned in this tutorial to try the other JavaScript charting libraries and gauge their suitability to visualize data and enhance the engagement of your website or application.
Do you have any questions or comments? Please post them below.
All the best.
The “How to Create Stunning Interactive Bar Charts Using JavaScript — Tutorial” article is published on the AnyChart blog with permission of Alfrick Opidi.
Originally published on DZone, Big Data Zone, under the title “How to Create Stunning, Interactive Bar Charts Using JavaScript” on March 22, 2019.
- Categories: AnyChart Charting Component, Charts and Art, HTML5, JavaScript, JavaScript Chart Tutorials, Tips and Tricks
- No Comments »