 Another brand new AnyChart Qlik plugin feature has arrived: Now it is possible to change the default settings in the configuration file of our Qlik extension for data visualization!
AnyChart Qlik plugin’s configuration file allows you to apply the default settings to all charts and dashboards created by the extension and customize them, which is impossible to achieve in the chart editor itself.
Configuration File Overview
In the desktop version of Qlik Sense, the configuration file for our plugin is named config.js. You can find it in the folder located at:
…\Users\\Documents\Qlik\Sense\Extensions\AnyChart-Qlik.
The file’s default content is as follows:
define([], function() {
  return {
    credits: {
      // You may customize the following settings only if a valid license key is provided.
      // Otherwise, your changes will be ignored.

      // enabled: true,
      // text: "",
      // url: "",
      // logoSrc: "",

      licenseKey: ""
    },

    localization: {
      // inputLocale: "",
      // outputLocale: "",
      // inputDateTimeFormat: "",
      // outputDateFormat: "",
      // outputDateTimeFormat: "",
      // outputTimeFormat: "",
      // outputTimezone: ""
    },

    defaultTheme: "",

    settings: {
      // These values determine the height of the hypercube (num rows on the data page).
      // maxDimensions * maxMeasures should be less than 10,000
      maxDimensions: 5,
      maxMeasures: 15
    }
  };
});
The default chart settings can be defined in this configuration file, and they will be applied to all the charts in your Qlik Sense project.
Next, let’s look into what you can set in the configuration file.
Available Settings
(1) Сredits and License Key
Put your license key in the licenseKey property and set up credits as follows:
credits: {
enabled: true, // put "false" to disable credits
text:  "Your company name",
licenseKey: "YOUR-LICENSE-KEY"
}
(2) Localization
Uncomment a property and specify a date/time pattern, locale, or timezone offset. Each field has a string value and is set according to the chart localization documentation.
(3) Chart Design Theme
Put the name of one of the pre-built chart design themes you want to use into the defaultTheme field, and it will be applied to all your charts.
You can change the default theme in Qlik in the General Theming tab.
Here is how the default theme is set:
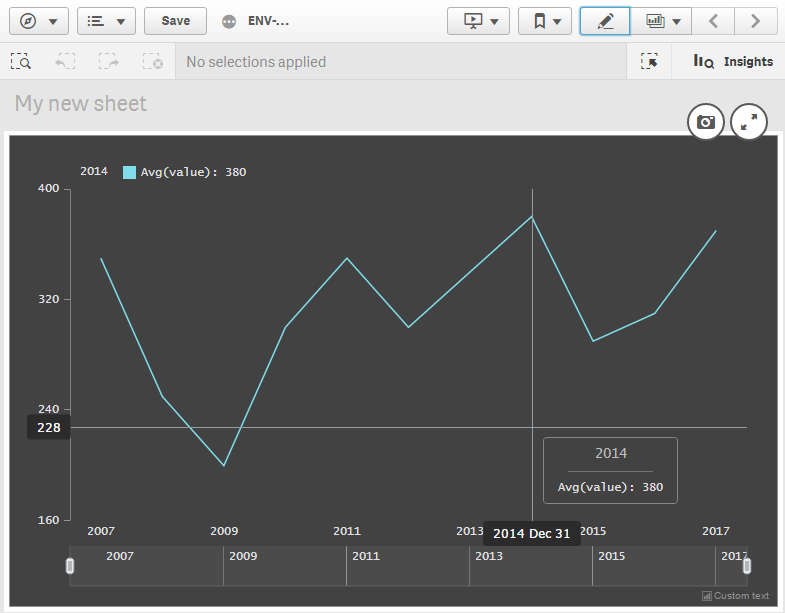
defaultTheme: "darkBlue"
For example, if you set darkBlue as the default theme, all the line charts you have will look as follows:
Qlik Extension Configuration File: Wrap-Up
Please be careful with the Settings section and only modify the things you clearly understand. It is easy to break all the charts in your project if you make any mistake here.
IMPORTANT: All changes in the configuration file are applied to the charts only after you restart Qlik Sense Desktop or Qlik Enterprise.
Make good use of this new awesome feature of our dedicated Qlik extension for data visualization when needed. If there is anything you’d like to suggest or ask, please contact AnyChart Support Team or leave a comment below.
- Categories: Big Data, HTML5, News, Qlik, Tips and Tricks
- 2 Comments »
Comments (2)
Can custom themes be created and used ? How is this done ?
Thanks
Hi, please contact our Support Team at support@anychart.com and we will be great to help you asap. Thank you.