 The New Year and Christmas are already just around the corner, and we have something astonishing for you in this magical time! The next major update for our product family of JavaScript charting libraries is now released, so meet AnyChart 8.1.0!
Check out what new cool and useful features are delivered in the new versions of our HTML5-based interactive data visualization solutions AnyChart, AnyStock, AnyGantt and AnyMap, as well as what we are going to work on next.
Major New Features in AnyChart JS Charts 8.1.0
AnyChart 8.1.0 brings a number of features and various improvements designed to help you create beautiful interactive JS charts for your HTML5 apps and websites even faster and easier. Below is a list of the major news.
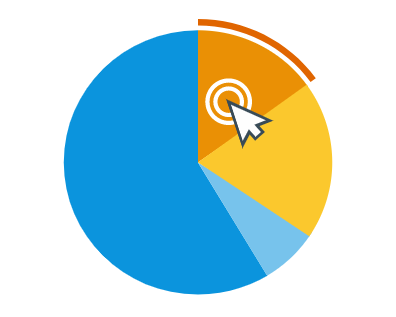 |
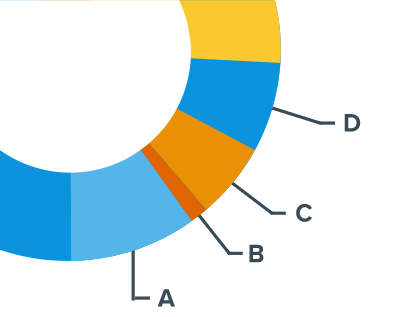
Pie Chart OutlineAlthough the outline itself does not carry any particular information on a chart, it can be utilized to make a Pie Chart stand out visually in comparison with the other charts and to stress the importance of the data displayed. By default, the Pie Chart Outline features the width of 10 pixels and the lighter fill color. See the Pie Chart with Outline chart example in our gallery. (Docs.) |
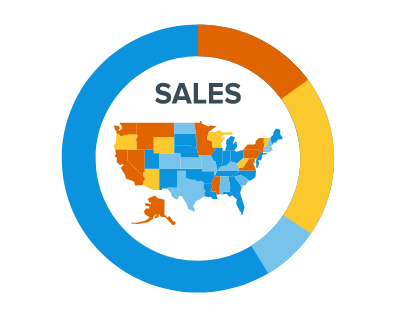 |
Center Content in Donut ChartsHow to efficiently use the space on a web page will always remain a topical question for the web design. To contribute to this field, we’ve introduced the center() method making the process of adding the content to the center of a Pie Chart as easy and convenient as possible. You can use center() to add text or other charts. See Donut Chart with Text as Center Content and Donut Chart with Geo Map as Center Content in our gallery. (Docs.) |
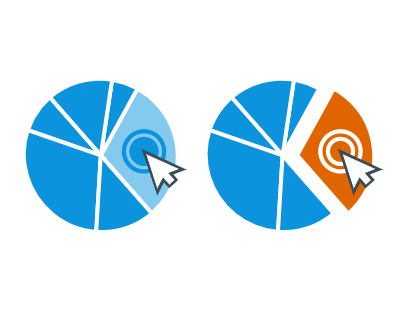 |
Pie Chart InteractivityNew methods are now available in Pie Chart: normal(), hovered() and selected(). They allow to configure any settings for the corresponding states, including fill(), stroke(), outline() and explode(). See the Donut Chart with Complex Interactivity Settings in the gallery. (Docs.) |
 |
Pie Chart Label Placement LogicThe improved Pie Chart Outside Labels distribution algorithm makes sure that labels are well-positioned and provided with enough space to be displayed in a clear, neat manner. The outsideLabelsSpace() method is now deprecated as far as its value is calculated automatically. See the Pie Chart with Dynamic Start Angle example to see how it works. (Docs.) |
 |
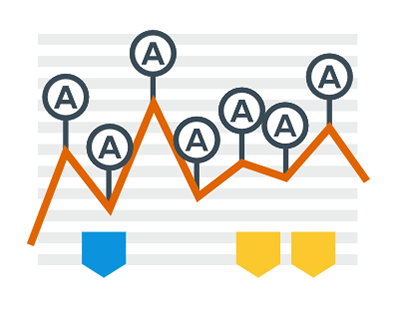
Label Annotation in Basic and Financial ChartsLabel Annotation is an excellent way to highlight particular data or events on a chart, add trendline captions and leave notes for data analysts. When it comes to analyzing stock data, the opportunity to add text annotations is often essential. Just like other types of annotations, a label annotation supports live editing and states, can be saved as JSON and provides a wide range of text settings. See the Annotated Labels Feature and Stock Chart with Label Annotations chart examples in our galleries. (Docs.) |
 |
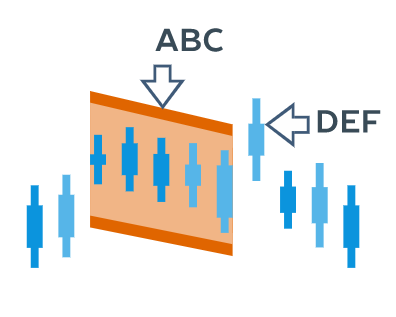
Event Markers in Financial ChartsEvent Markers are now one of the greatest features of AnyStock. It’s a special type of chart markers designed to provide the best experience in showing various events on financial charts: Key Developments, Dividends, Splits, etc. This information is important for financial analysis and has to be properly visualized. So we’ve equipped AnyStock with a very flexible and convenient set of tools for working with Event Markers. See Stock Event Markers and Stock OHLC Chart with Sidebar Events Feed. (Docs.) |
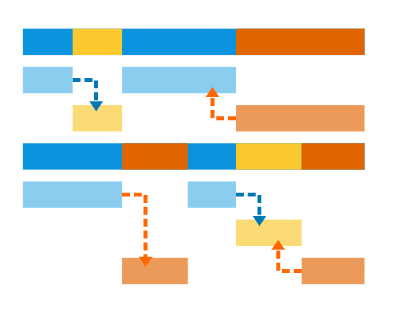 |
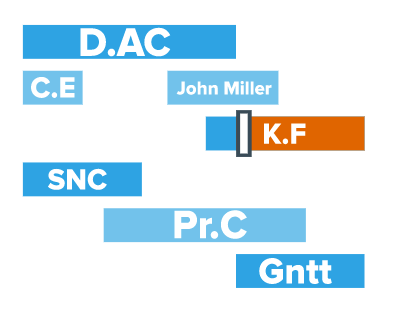
Conditional Coloring in Gantt ChartsNow it’s possible to apply colors to the elements of Gantt charts using functions. Each of the functions contains a comprehensive set of data about an element to be colored. See the AnyGantt version history for the complete list of methods now supporting such functions and our Gantt Chart with Conditional Coloring chart example in the gallery. (Docs.) |
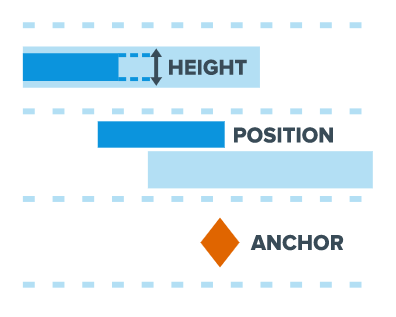 |
Element Size and Position Settings in Gantt ChartsTo improve the visual perception of Gantt Charts and make it easier to customize them according to a style, we’ve added a lot of settings for adjusting the size and the position of all elements in a Gantt Chart. See the AnyGantt version history for the complete list of such methods and our Gantt Chart with Elements Custom Size and Position chart example in the gallery. |
 |
Adaptive Text Formatting in Gantt ChartsNow you can adjust the format of Gantt Timeline labels manually using the new measureWithText() method. See the Gantt Resource Chart with Adaptive Labels Format example to get an idea of how it works. (Docs.) |
More Improvements in AnyChart 8.1.0
In addition to these major new features in AnyChart 8.1.0, there are also a lot of other general and library-specific improvements as well as bug fixes.
To learn more about everything that’s been updated and can be tried out now, please refer to the version histories of our JavaScript (HTML5) chart libraries: AnyChart, AnyStock, AnyMap, AnyGantt.
We’ve also released the 2.2.0 version of the AnyChart Extension for Qlik Sense. It has delivered Treemap Chart, Radar Chart and Polar Chart as well as New Chart Type Select Control and AnyChart Qlik Demo Application. Learn more on the extension’s page.
Expect New AnyChart JS Charts in March 2018
The next version of AnyChart is expected to go live in about three months, in March 2018. Our plan on the nearest following versions includes the release of the following:
- HTML Tooltip Support in all the charting libraries;
- Min/Max Data Labels in AnyChart and AnyStock;
- Sunburst Chart type in AnyChart;
- Additional Touch Support in AnyStock;
- Data Grid Live Editor and Brand New Timeline in AnyGantt.
Here are the links where library-specific roadmaps can be found: AnyChart, AnyStock, AnyMap, AnyGantt.
Please let us know if you’d like to see any new chart type or charting feature available in AnyChart’s JS charting libraries. Simply contact our Support Team, describe the details and it’s absolutely possible that your suggestion will become a part of one of the next releases!
Best wishes for a wonderful holiday and a happy new year! Enjoy AnyChart 8.1.0!
- Categories: AnyChart Charting Component, AnyGantt, AnyMap, AnyStock, Financial Charts, Gantt Chart, HTML5, JavaScript, News, Qlik, Stock Charts
- 2 Comments »
Comments (2)
please include a linear regression projection feature
Hello, thanks for your interest in our data visualization solutions! We will consider your suggestion, but it is really easy to integrate 3rd party libraries like regression js to AnyChart: https://jsfiddle.net/Shestac92/fpLLjshd/5/