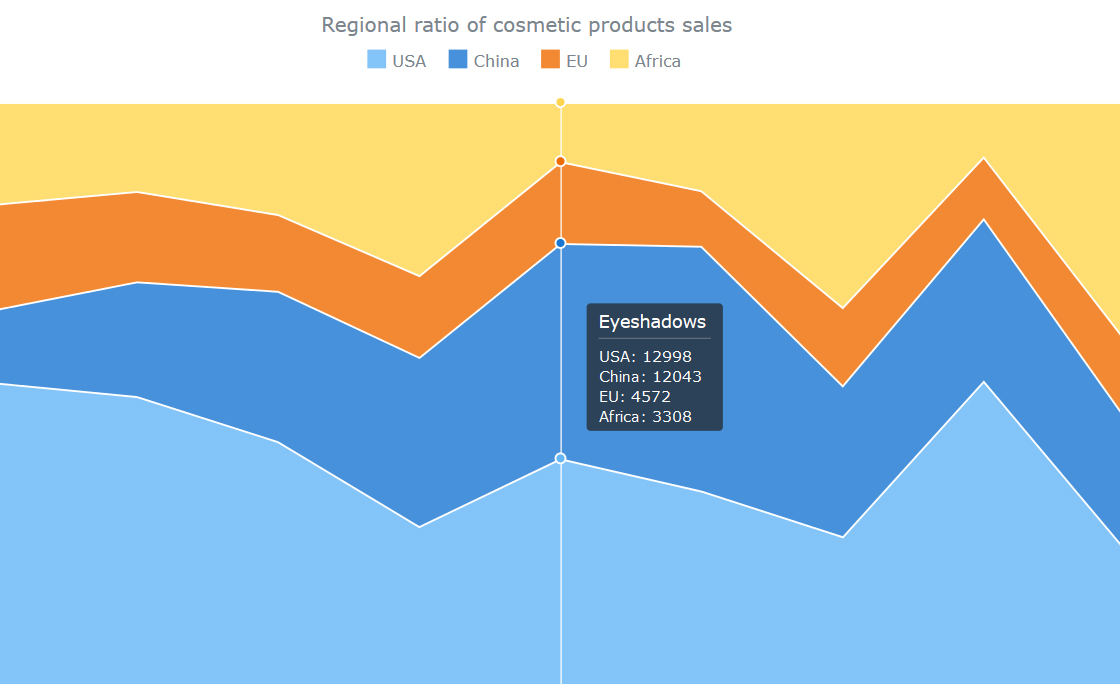
Here is a quick recap of the visualizations (and related information) that we have shared with you this week on AnyChart Facebook Page and in Twitter (including a JS Stacked Area chart by AnyChart):
- Six Infographics for Independence Day – The Declaration of Independence, signed on July 4th, 1776, is both a symbol of American liberty and an enduring monument to the philosophy of America’s forefathers. But Today, Independence Day is more than a celebration of this important moment in history. It’s also an opportunity for robust American fun: fireworks, hot dogs, excessive drinking, and lounging about in the summer sun. Here are 6 infographics that explore the history, patriotism, pyrotechnics, and personal excesses of one of America’s favorite holidays.
- Dontclick.it – What changes for the user and the interface once you can’t rely on the habit of clicking? Check out Dontclick.it, an experimental clickfree interface, and see is clicking is irresistible for you!
- 10 Cities Americans Are Moving To Right Now – Whether for professional or personal reasons, people sometimes pick up and move. In the United States, folks have been migrating to urban areas in recent generations, but these days the places they wind up are not necessarily the major hubs we might expect. Real estate information platform, Realtor.com, combined its internal data with U.S. Census Bureau information and discovered where Americans are moving these days. The results might surprise you.
- AnyChart JS Stacked Area Chart – This interactive 100% Stacked Area chart was created with our charting component. Stacked Area charts are multi-series Area charts that display the trend each value contributes over time or categories. They are good at emphasizing the magnitude of changes over time, as well as at drawing attention to the total value across a trend. In a 100% Stacked chart, values are not displayed, and only the percentage each value contributes is shown, so that users can easily compare them.
- Categories: AnyChart charting component, HTML5, JavaScript, News
- No Comments »
