 Every week we come across a variety of new data visuals out there and, through DataViz Weekly, put a spotlight on the ones we like most. Check out the latest edition, featuring:
- Talk of threats to democracy in the U.S. Congress — The Pudding
- Tariffs reshaping U.S. imports — The New York Times
- Daily activities of Americans by gender — FlowingData
- Birds as feathers — Jer Thorp
Data Visualization Weekly: October 31, 2025 – November 7, 2025
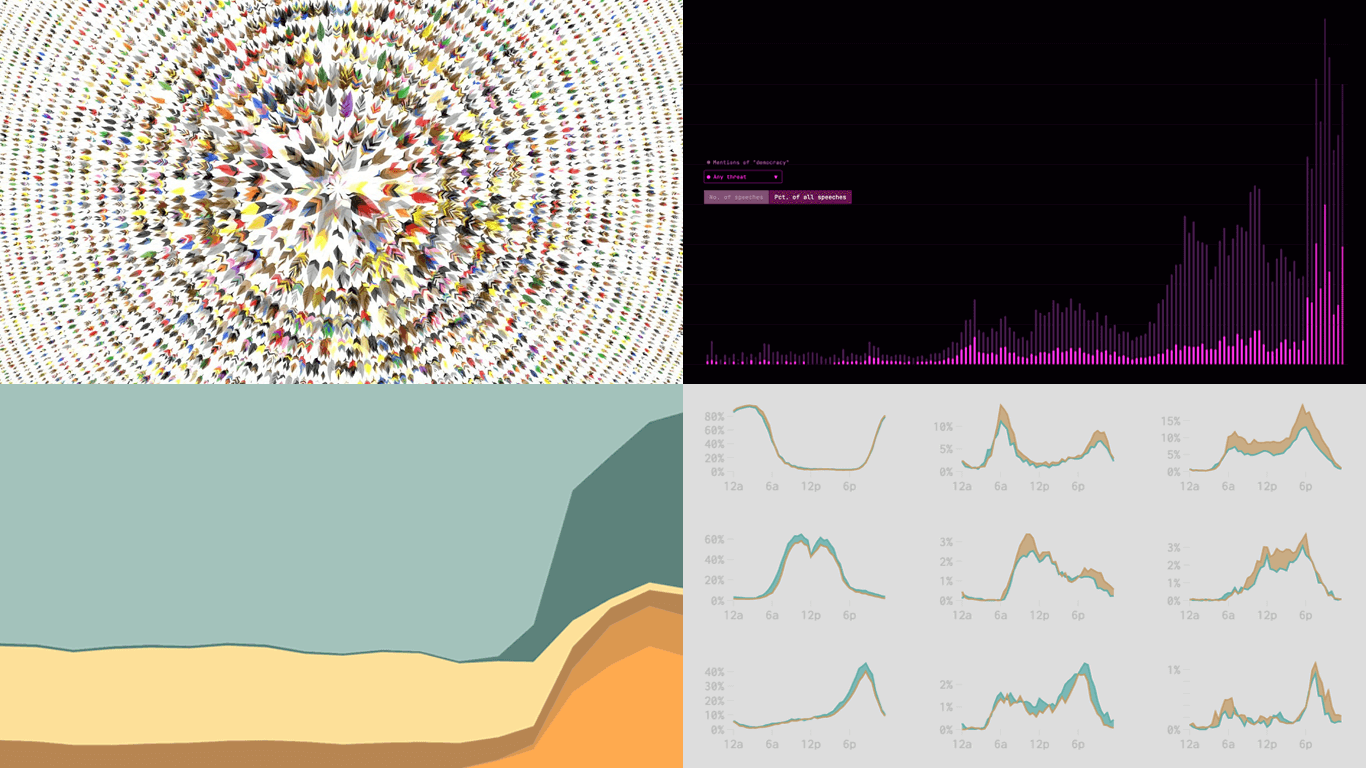
Talk of Threats to Democracy in U.S. Congress
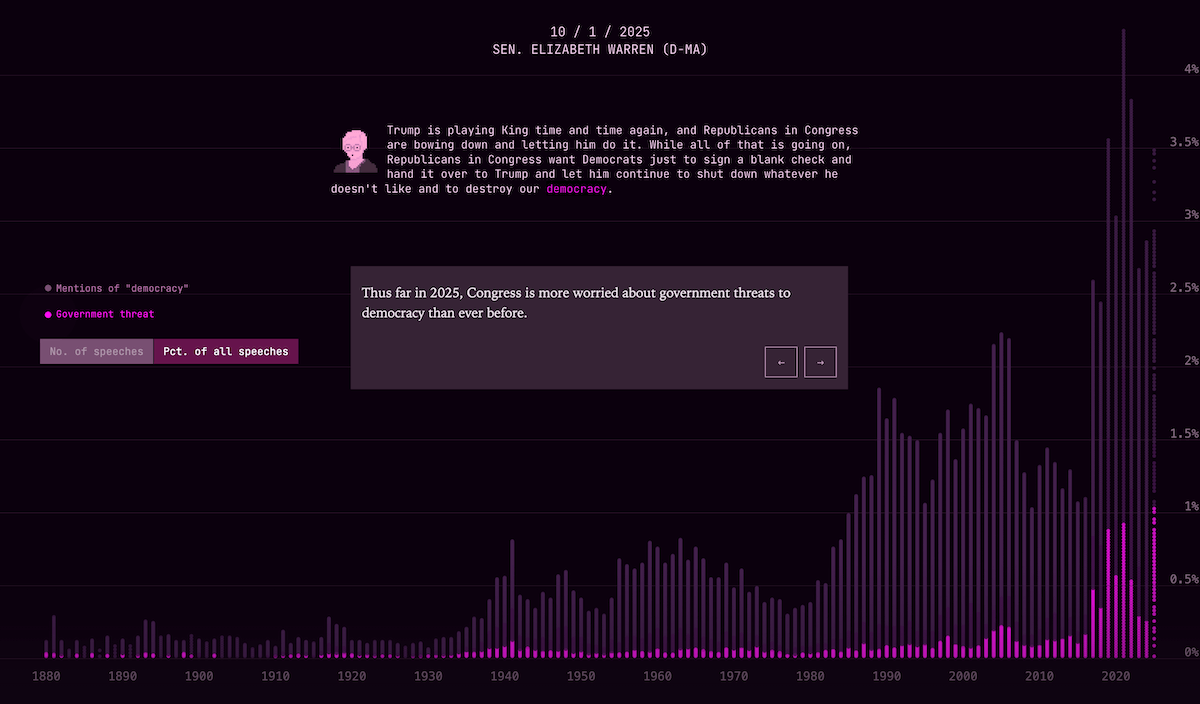
How often do members of the U.S. Congress talk about democracy, and when do they view it as at risk? A new project traces this discussion through nearly a century and a half of legislative debate.
The Pudding published a visual essay by Alvin Chang that examines how U.S. lawmakers have discussed democracy since 1880. In the visualization, each dot represents five congressional speeches containing the word, with brighter points marking those that describe democracy as under threat. Google’s Gemini 2.0 Flash language model was used to classify the surrounding context, distinguishing between general, foreign, internal, and systemic concerns. As readers scroll, the dots align into a chronological display that arranges into a column chart–based timeline, showing how congressional discussion of democracy has evolved over time.
Explore the story on The Pudding.
Tariffs Reshaping U.S. Imports

Nearly half of all goods entering the United States now face tariffs, reflecting a major shift in the country’s trade structure. The composition of imports has changed markedly in the past two years, with new tariff categories redefining how global products reach the U.S. market.
The New York Times visualizes this transformation with a series of percent stacked area charts based on U.S. Census Bureau data on international trade. The first visualization in the article shows how the composition of U.S. imports under various trade rules changed between January 2024 and July 2025. Further charts highlight imports from China, the European Union, Mexico, Canada, Ireland, Taiwan, Japan, and South Korea, each revealing a distinct mix of tariff categories. Together, they show how recent trade measures have altered the overall makeup of U.S. imports.
Check out the piece on The New York Times, by Lazaro Gamio, Keith Collins, and Ana Swanson.
Daily Activities of Americans by Gender
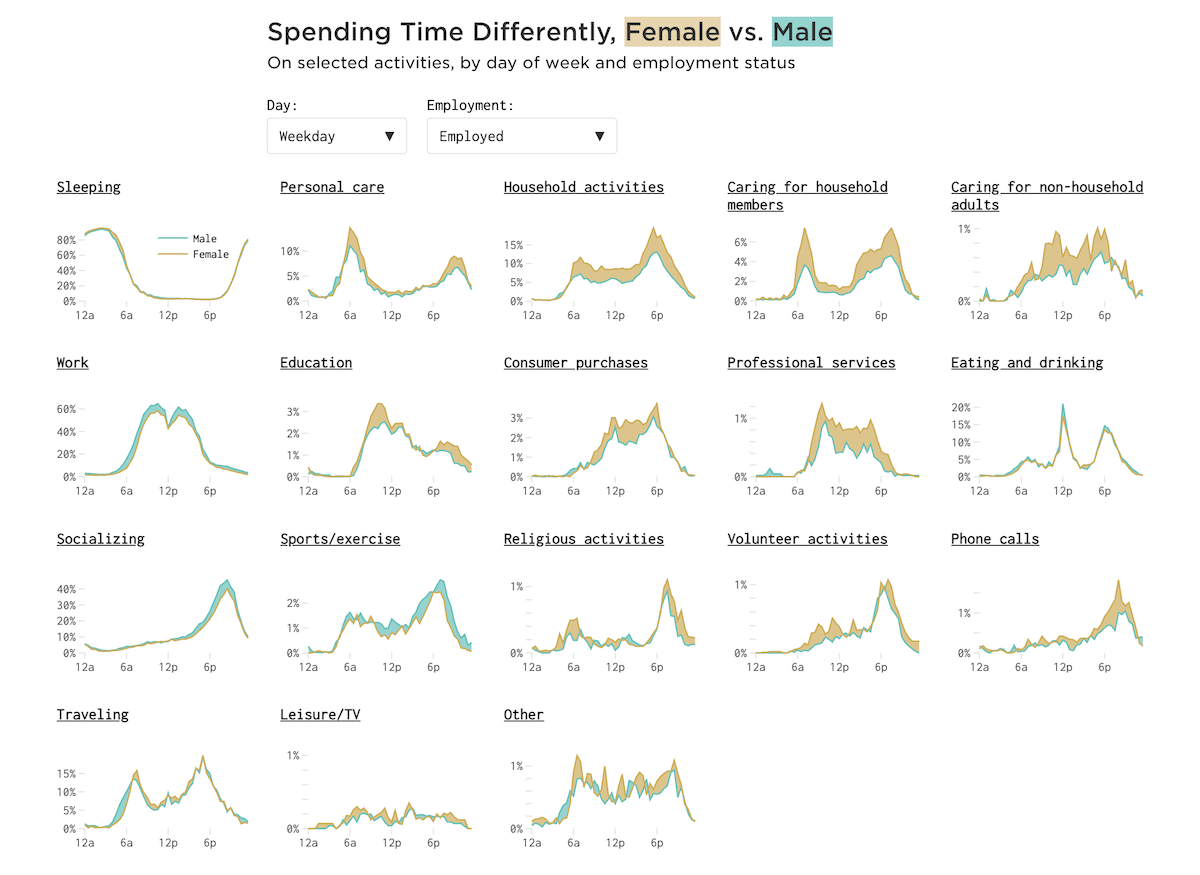
Men and women in the United States structure their days differently, as shown by national time-use data. Viewing a full 24-hour cycle makes these differences clear in how activities are distributed through the day.
Nathan Yau visualized data from the American Time Use Survey using a difference chart, which looks similar to a range area chart. The first chart compares men and women on household activities during a typical weekday. A series of smaller charts then shows 18 activity categories, from sleeping and working to socializing and exercising, with options to switch between weekday and weekend and by employment status.
Look at the post on FlowingData.
Birds as Feathers
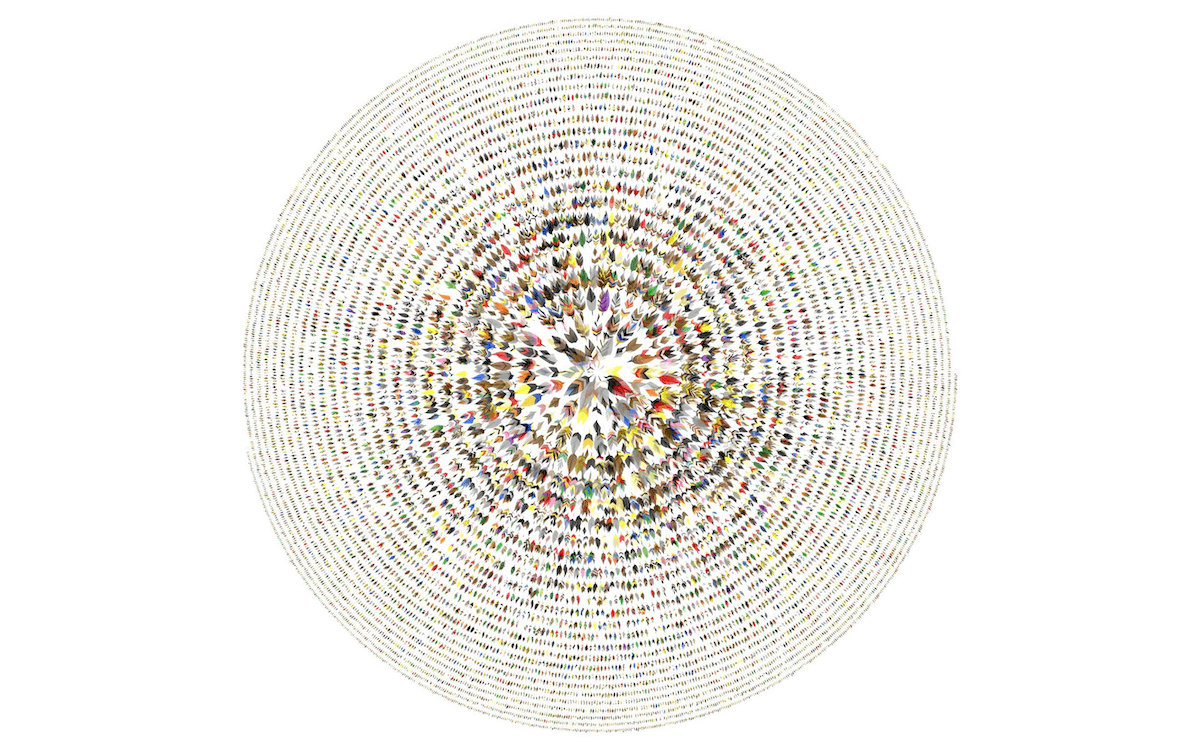
Last but not least in this edition, we would like to spotlight another project that caught our eye. And you can even get it as a poster.
Jer Thorp portrayed nearly all known bird species, more than 10,000 in total, as individual feathers, each colored according to descriptions found in their Wikipedia entries. The image above brings the entire avian diversity together in a single visualization. In his Bluesky thread, Thorp also presents focused subsets such as parrots, hummingbirds, and birds located within ten miles of his own position, and mentions that he plans to release the code and data behind the work. His website offers matching posters, hoodies, and T-shirts.
See the Bluesky thread, and visit the project page if you’d like to make a purchase.
Wrapping Up
That wraps up this edition of Data Visualization Weekly. Stay tuned for more great examples showing how charts and maps can let data talk.
- Categories: Data Visualization Weekly
- No Comments »