 At AnyChart, we are eager to support education projects by letting their creators work gratis with the same data visualization solutions used by the world’s leading companies to build interactive charts.
Recently, a group of students at Edinburgh Napier University — including Martin McVey, Tibor Toth, Daniel Glen, Flynn Kearney, David Stewart, and John Frampton — reached out to us as they were building a website to assist with the learning of data science. And we were more than happy to provide them with a free license for the use of our JavaScript charting library.
The website is now available to the public, presenting a wide range of chart types with real-world examples along with questions and answers. Acknowledged as one of the top projects in the university year and awarded with a prize from Computershare, it is to be used for teaching about data visualization and analytics in Scottish schools.
We thought you could be interested to not only check out the website but also learn some more about the project and its developers’ experience with AnyChart. So we had a quick talk on that with Martin McVey from the team. Read below.
AnyChart: To begin with, could you please tell our community about your team and the origins of this project?
Martin McVey: We are fourth year Software Engineering Students at Edinburgh Napier University. The team was created for the purpose of this particular project proposed by Data Education in Schools as part of the Group Project module within the framework of our course.
On seeing the available project, this one was of particular interest and me and another student put together a team to make a bid. We had roughly four months from meeting each other, submitting for the project to the completion and presenting our finished product to the university and the client.
A: What is the purpose of the project?
MM: The main aim of the project is to help students learn about data science while on their way to achieving a National Progression Award. This should be achieved through an educational website that presents a wide range of chart types with questions and answers for each chart. This will also assist teachers giving lessons on the subject, as they will have interactive materials ready with the content, questions, and answers for their students to explore.
A: How does it look now and what is planned next?
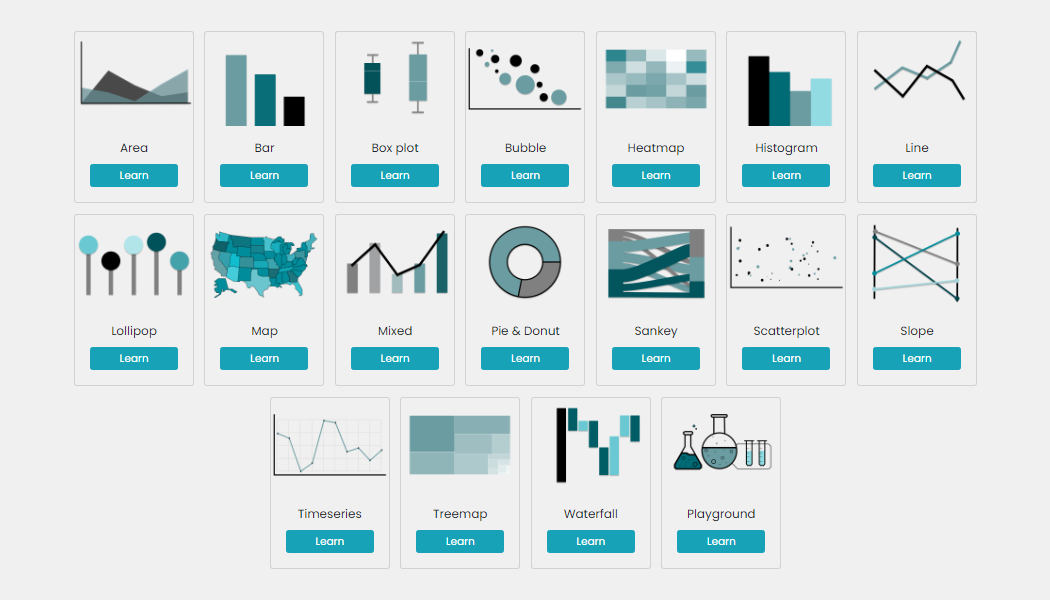
MM: We have created a finished website product as requested which showcases many different data types and visualisations along with questions and answers to assist students and teachers with the learning of data visualisations.
The product has now been handed over to the client which will hopefully be in use throughout Schools in Scotland and beyond as the Data Science subject is enrolled throughout more schools.
A: How did you use AnyChart in this project? What kind of data is visualized and in which chart types?
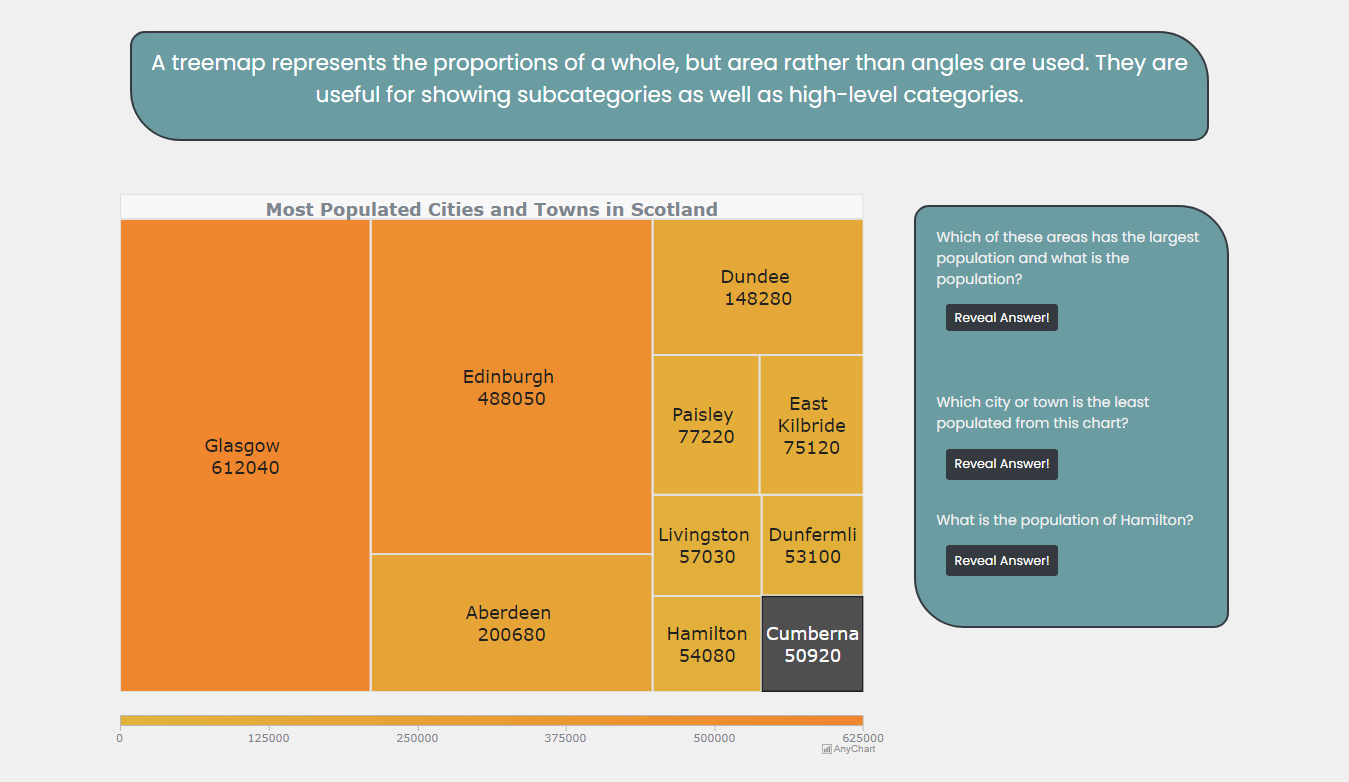
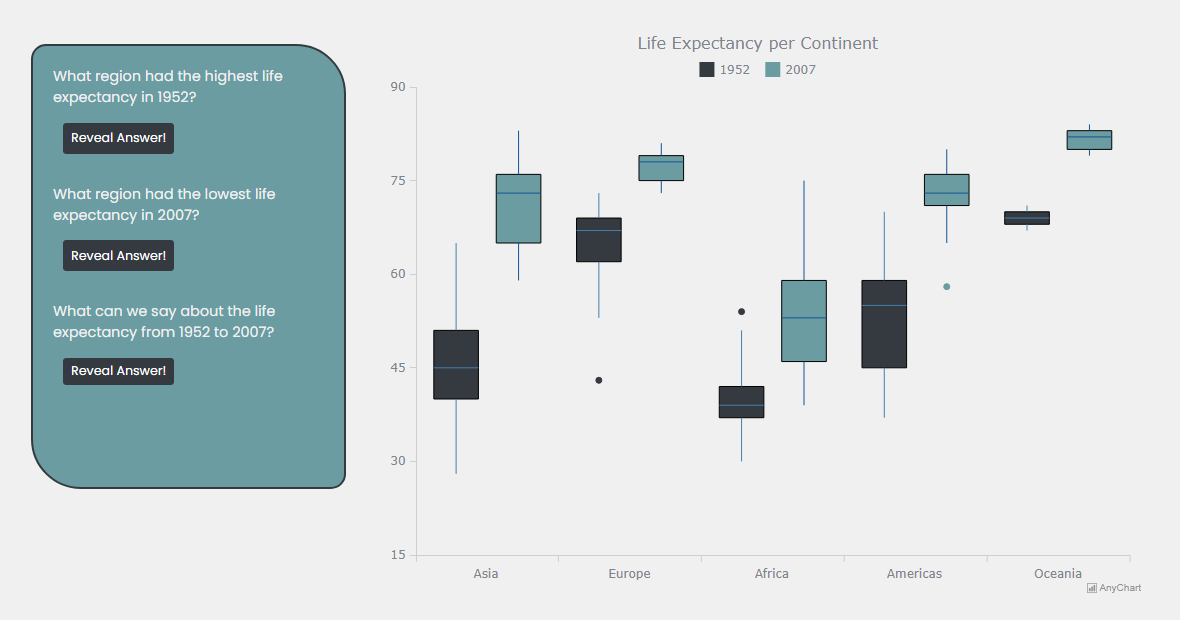
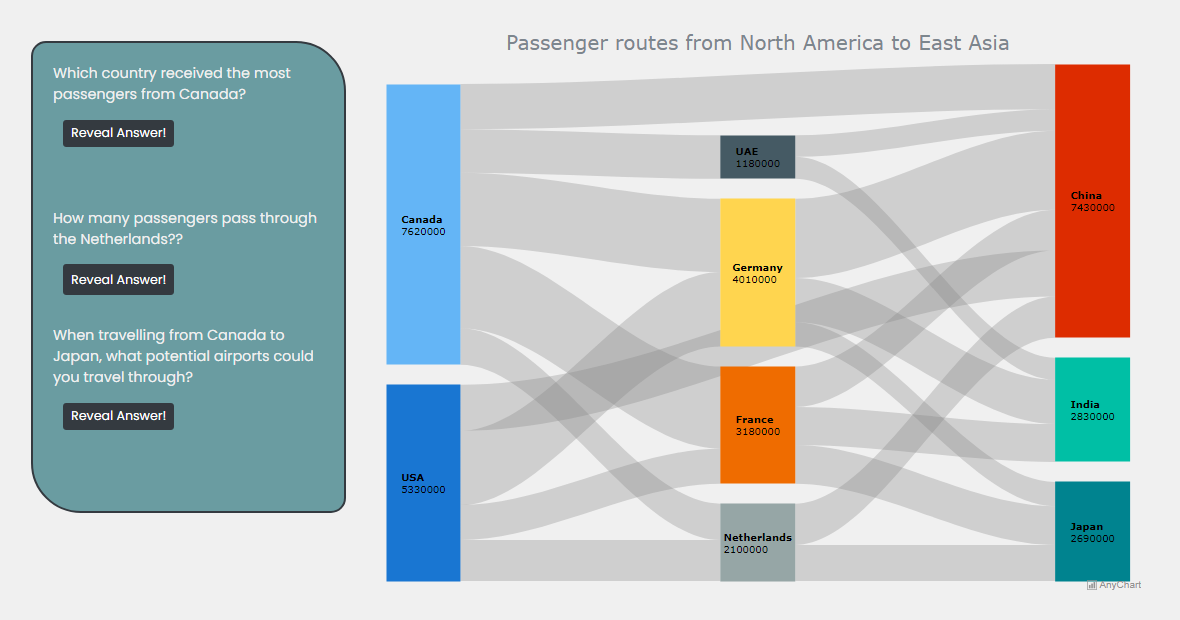
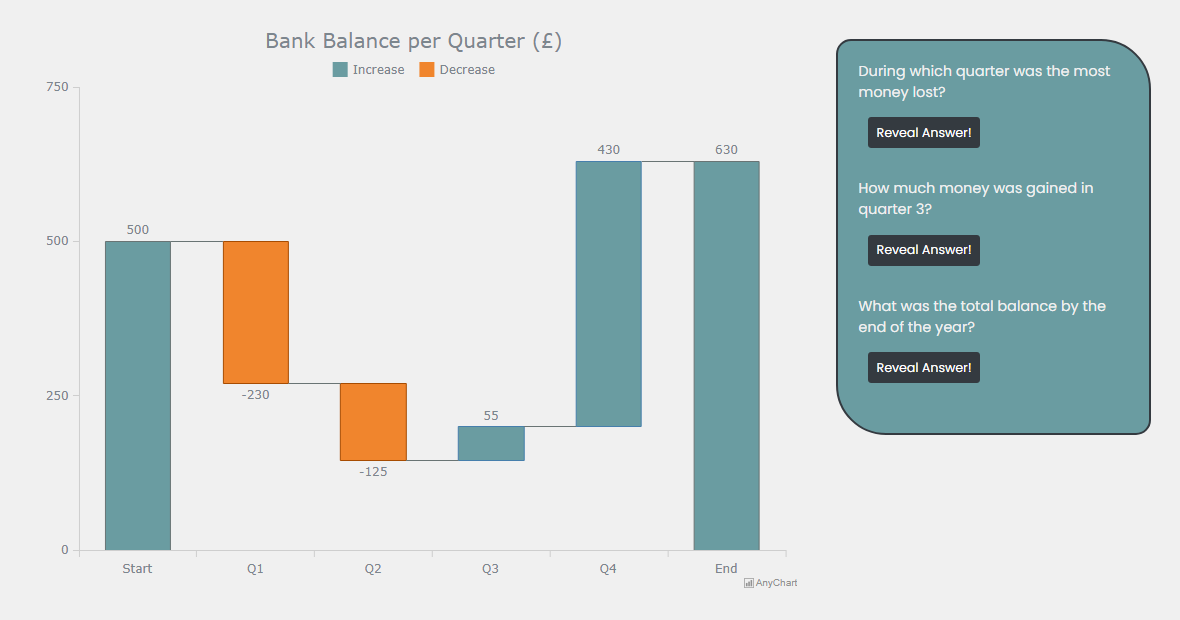
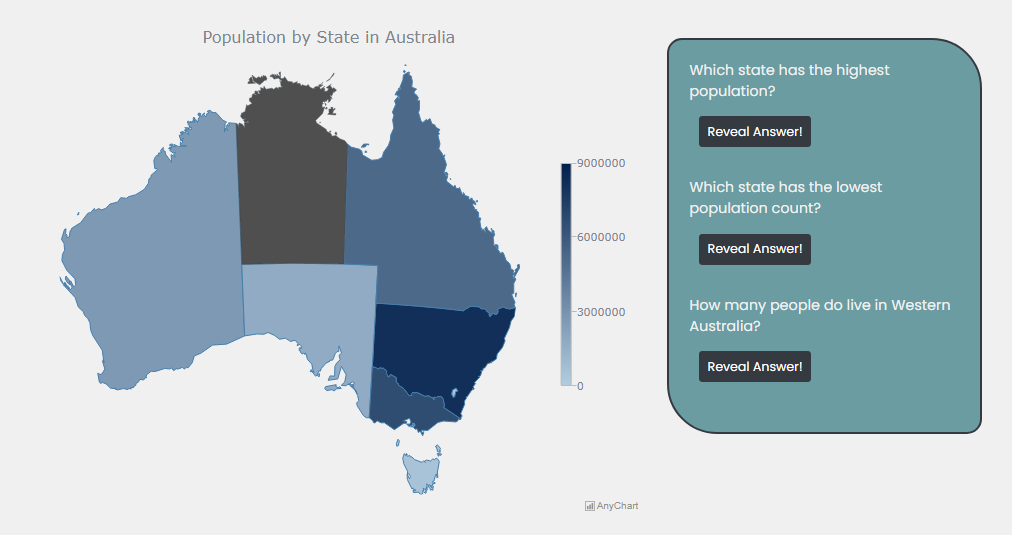
MM: We use real world data for a lot of our visualisations to give the students a better hands-on experience. We were able to create a number of different charts with help from AnyChart, including box plots, choropleth maps, Sankey diagrams, treemaps, waterfall graphs, and more.
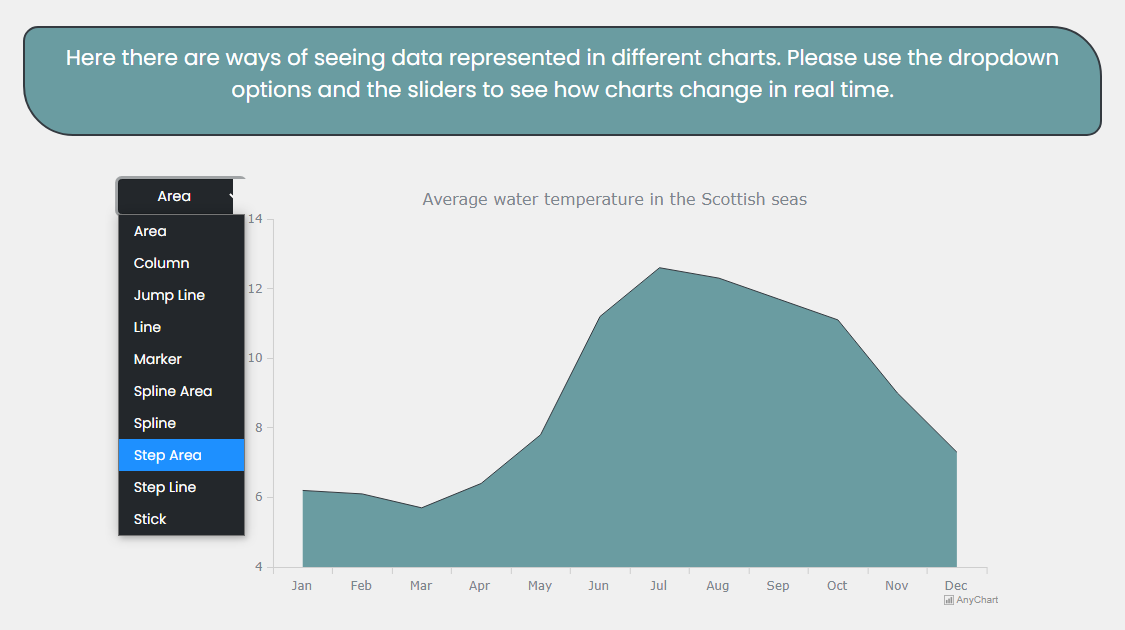
For the Playground section of the website, designed to demonstrate how the same data can be visualized in different ways, we used area, column, jump line, line, marker, spline area, spline, step area, step line, and stick charts.
A: What tech stack is your project running on?
MM: The website was built with HTML, PHP, Bootstrap CSS and JavaScript. The database is MySQL.
A: Choosing the right JavaScript charting library for a certain project may be quite a challenge as there are many out there. How did you make your choice?
MM: During our first meeting with the client, we discussed how they wanted us to achieve certain goals. Initially we agreed on using D3.js to create the charts for the project. We thought this would give us the best results and it was recommended by the client. After further research and deliberation, another library that was easier to implement, yet gave additional functionality meeting the Moscow priorities was found, AnyChart. So we contacted you, were able to get a license for free as we are students, and switched to it, in tandem with Chart.js.
A: So, how was the charting? Simple enough?
MM: The libraries used have a huge user base and community that made our development easier. Creating interactive charts that bring new features to the pages was seamless as we had a wide range of options available.
A: What could you advise us to work on next?
MM: There is always room for improvement in how something looks and feels on a mobile device. Maybe something in that direction.
A: When asked what JS charting library to use for data visualization, how would you recommend AnyChart and explain why in one or two sentences?
MM: AnyChart was easy to use and has a vast amount of documentation. I would recommend it to anyone, as it provides everything a developer and an end user would want.
A: Thank you and best of luck to all of you in your future endeavors!
If you want to share your AnyChart story, let us know!
See more customer stories as well as selected case studies.
- Categories: AnyChart Charting Component, AnyMap, HTML5, JavaScript, Success Stories
- No Comments »