 Join us as we look at some of the most interesting data charts and maps we have seen out there these days. Here’s what visualizations are featured today on DataViz Weekly:
- Presidential party results in midterm and other elections in the U.S. — Reuters
- Six indicators of (worsening) climate change — Le Monde
- Global greenhouse gas emissions in detailed inventory — Climate TRACE
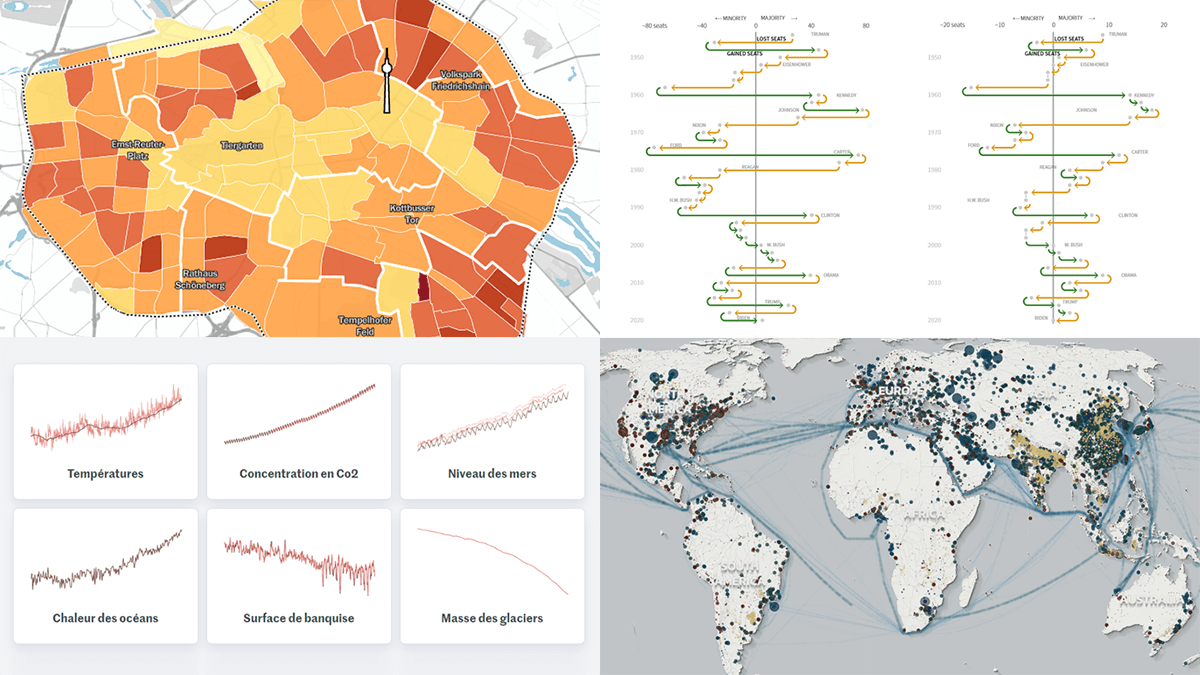
- Car parking spaces in Berlin — Tagesspiegel
Data Visualization Weekly: November 4, 2022 — November 11, 2022
Presidential Party Results in Midterm and Other Elections in U.S.
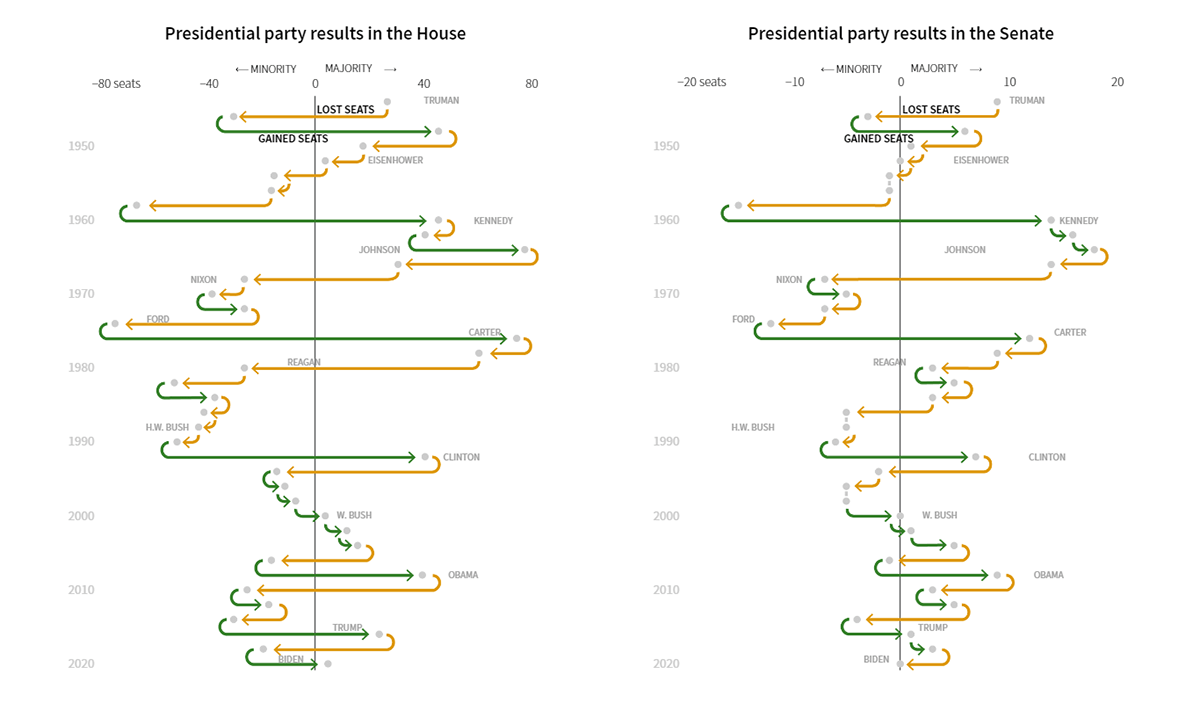
The 2022 U.S. midterm congressional elections were held on Tuesday. Not all ballots have been counted so far, so it will take some more time before we get to know the complete final results.
What’s known from history is that after midterms, the presidential party usually loses seats in both chambers of Congress. That is greatly shown by the cool charts made by Travis Hartman. In his visual article on Reuters, the first thing you see is how the party in power has fared in all the House elections since the end of World War Two. As you scroll, the arrows representing non-midterm shifts disappear to let you focus on the midterm results. Then the Senate elections are displayed in the same manner.
Check out these (and more) charts on Reuters.
Six Indicators of (Worsening) Climate Change
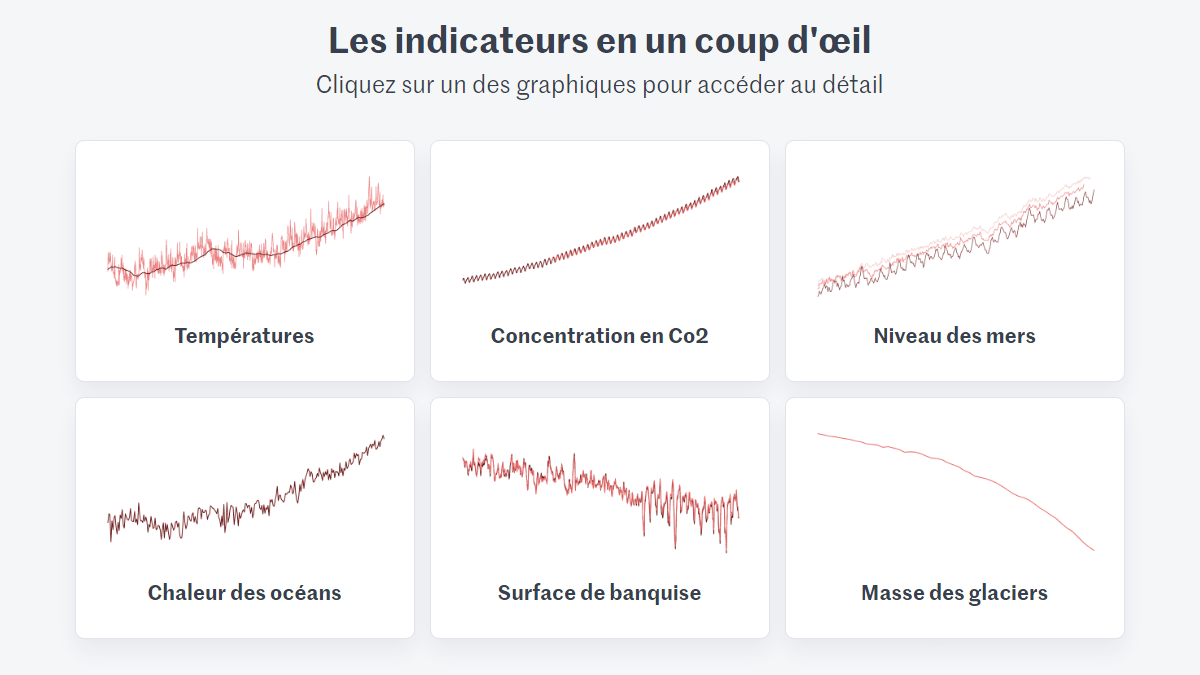
The 27th United Nations Climate Change conference, or simply COP27, began in Egypt last Sunday. It is expected to be attended by representatives of 190 countries, including over 90 heads of state.
A few days before COP27, Le Monde published six charts that visualize six indicators of climate change over time. The indicators are global temperature (since 1900), CO2 concentration (since 1958), sea level (since 1993), ocean heat content (since 1955), ice surface area (since 1979), and glacier mass loss (since 1970). The authors of this interesting visual piece are Maxime Ferrer, Raphaëlle Aubert, Romain Imbach, and Thomas Steffen.
See the charts on Le Monde.
Global Greenhouse Gas Emissions in Detailed Inventory
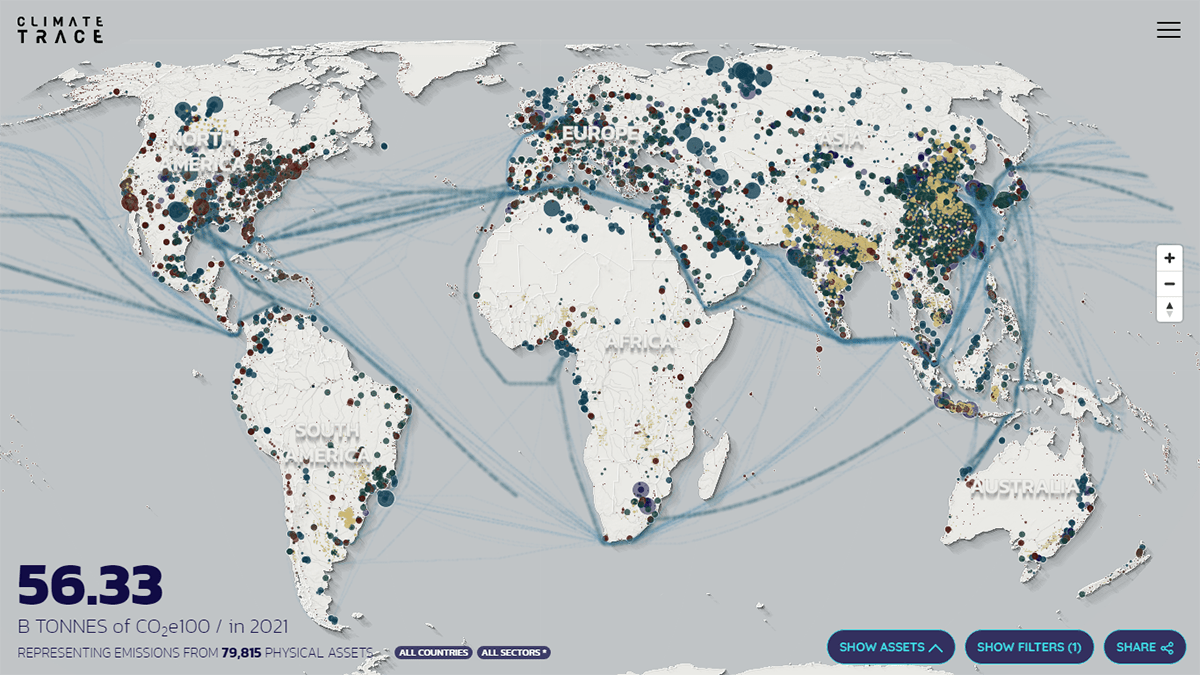
A single steel mill can easily emit more greenhouse gas than some countries. Power plants, oil fields, and airports are also among the biggest sources of climate pollution, and now there is an interactive data visualization project that lets us recognize them all and who is to blame for what.
The Climate TRACE coalition made an extremely detailed inventory of global greenhouse gas emissions at the facility level, which was presented by Al Gore at COP27 earlier this week. The data can be explored using an interactive map. The map shows over 79,000 of the worst climate polluters along with how much they are known to emit. Filters allow you to focus on individual countries, sectors, and gases (carbon dioxide (with CO2E as a separate option), methane, or nitrous oxide).
Look at the map on the website of Climate TRACE.
Car Parking Spaces in Berlin
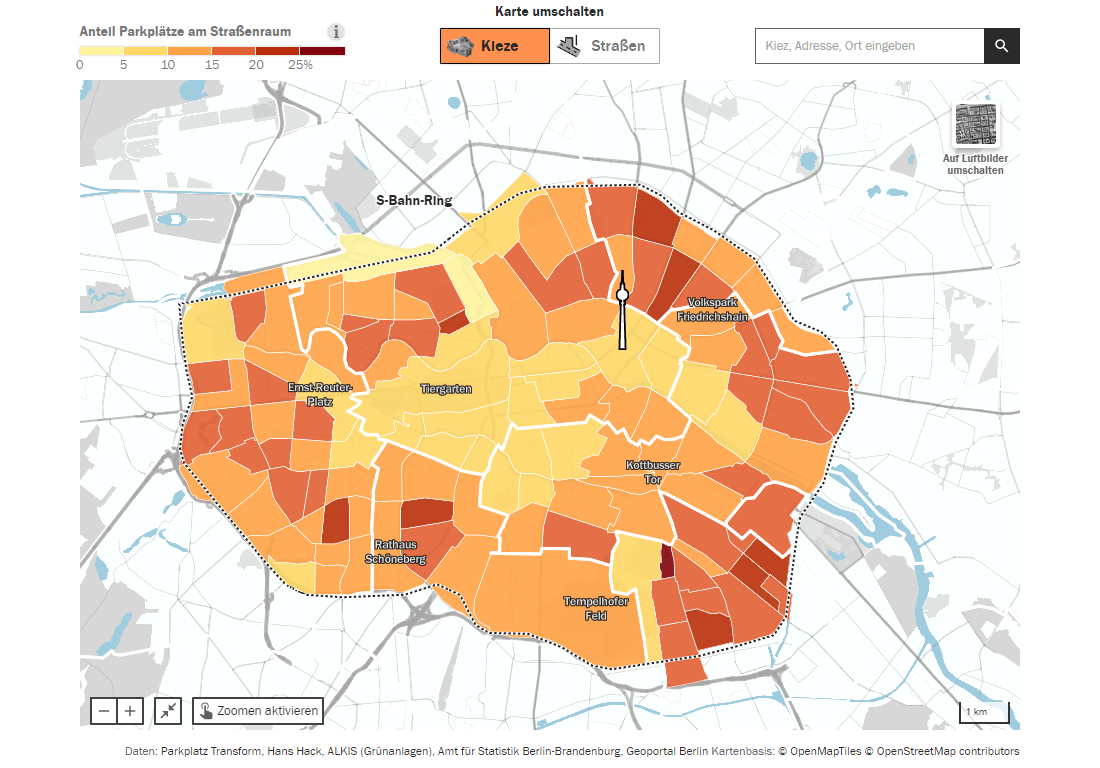
There are about 1.24 million cars registered in Berlin. And just like in any big city, parking is a problem.
Tagesspiegel — namely Nina Breher, Tamara Flemisch, Hendrik Lehmann, David Meidinger, and Lennart Tröbs — used a map to represent and analyze the availability of parking spaces across Berlin. Each of the city’s neighborhoods is colored based on what percentage of its road space belongs to parking lots. Click on an area to find out how that compares to the percentage of the neighborhood area taken by playgrounds and green spaces.
Explore the map on Tagesspiegel.
***
On Data Visualization Weekly, we do our best to make sure you don’t miss the most interesting charts and maps out there. Stay tuned!
- Categories: Data Visualization Weekly
- No Comments »