 DataViz Weekly keeps you informed of the latest data visualizations that are definitely worth seeing, from our point of view. Check out our new picks:
- American bird migration — Audubon
- Ukrainian children dismissed from residential care institutions — Reuters
- Mega warehouses and their impacts — Sierra
- Age of the U.S. political leaders — Insider
Data Visualization Weekly: September 19, 2022 — September 25, 2022
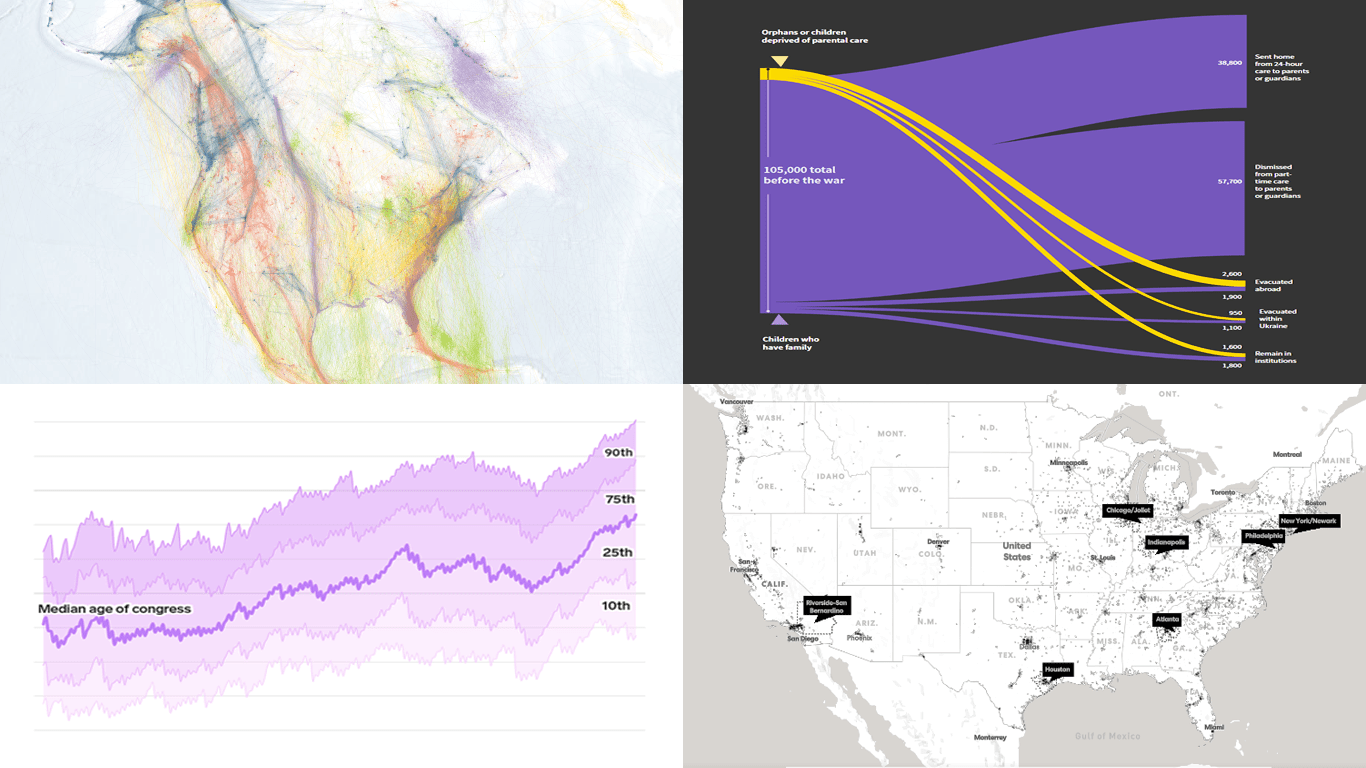
American Bird Migration
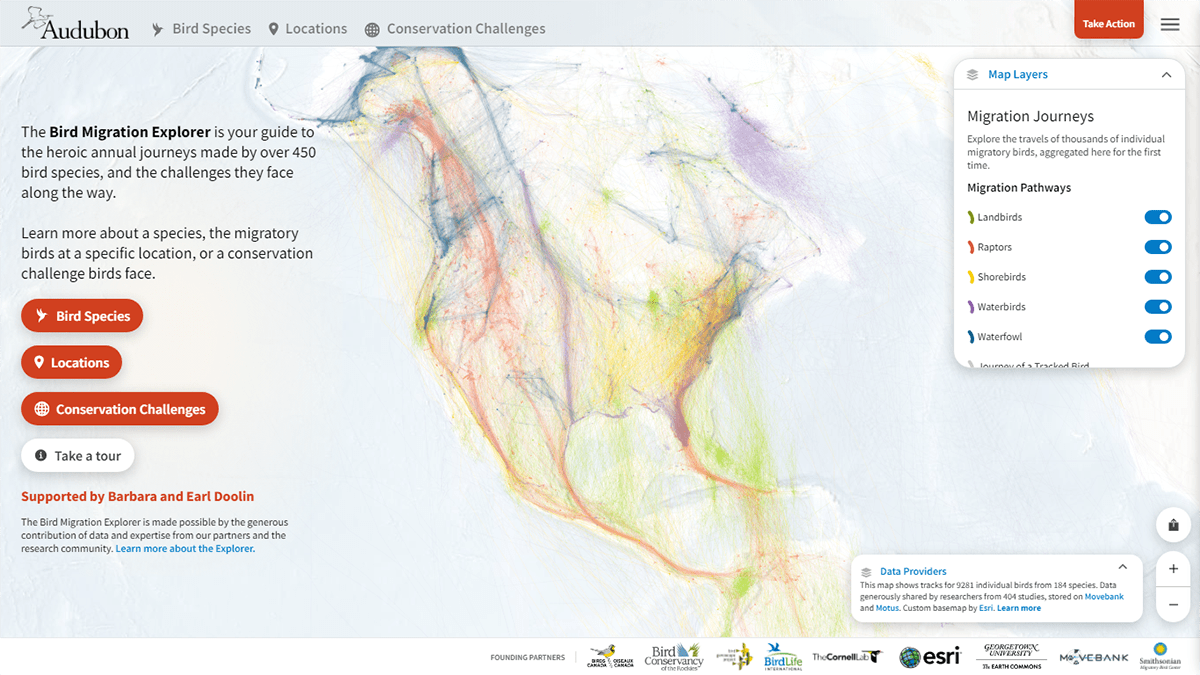
Fall migration of birds has already started. For everyone wondering which ones move where and when, there is an amazing new tool out there.
Audubon, an American environmental nonprofit, launched the Bird Migration Explorer. Using data from various researchers across multiple organizations, it represents the annual journeys of more than 450 migratory bird species regularly breeding in the U.S. and Canada. You can see how an individual species migrates in the Western hemisphere, find out which ones can be seen in a specific location, and learn about the conservation challenges birds are facing.
Check out this interactive guide to bird migrations at explorer.audubon.org.
Ukrainian Children Dismissed from Residential Care Institutions
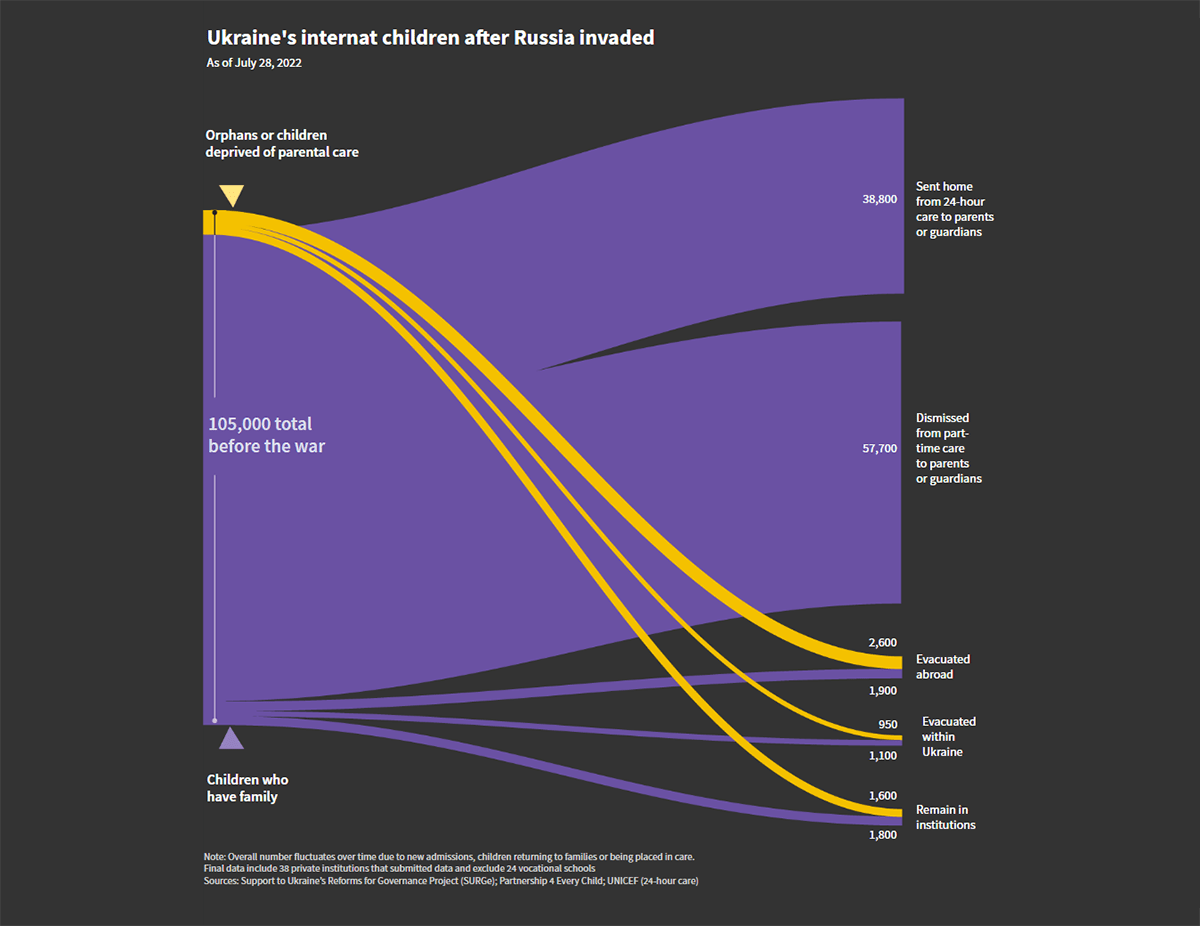
At the time when it all started in February 2022, orphanages all over Ukraine were taking care of over 100,000 children. Then the vast majority of these children were dismissed to their parents or guardians or evacuated. Tracing all of them appeared to be too complicated.
Currently, Ukraine is trying to find about 26,000 dismissed children with the help of UNICEF, and Reuters offers a deep dive into the situation and the challenges of tracking those kids. The reporting features a series of impressive data graphics created by Sarah Slobin.
See the story on Reuters.
Mega Warehouses and Their Impacts
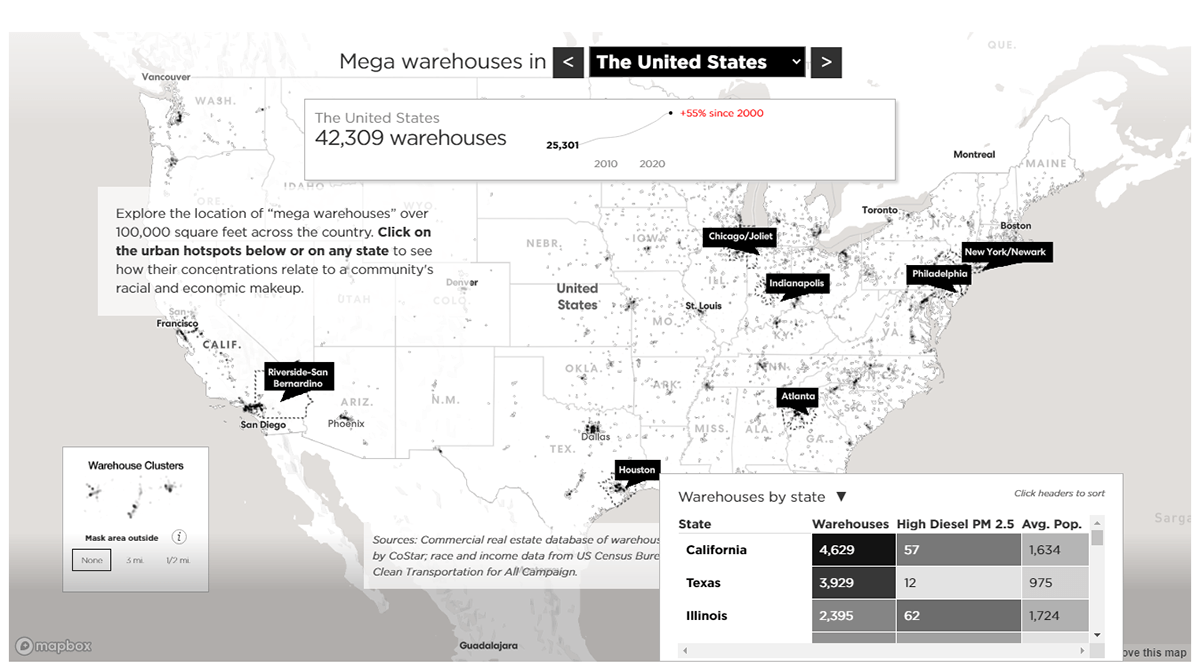
Online shopping keeps growing, and there are already dozens of thousands of warehouses and distribution centers of more than 100,000 square feet all over the United States. But living near such a mega warehouse goes hand in hand with (permanently) experiencing noise and pollution.
For Sierra, the magazine of the environmental organization Sierra Club, Geoff McGhee mapped their location across the U.S. In addition, he overlaid demographic data about nearby residents and diesel PM 2.5 exposure. The resulting interactive visualization reveals the distribution of mega warehouses nationwide and which communities are the most vulnerable to the impacts of the rise of e-commerce.
Look at this interesting project on Sierra.
Age of U.S. Political Leaders
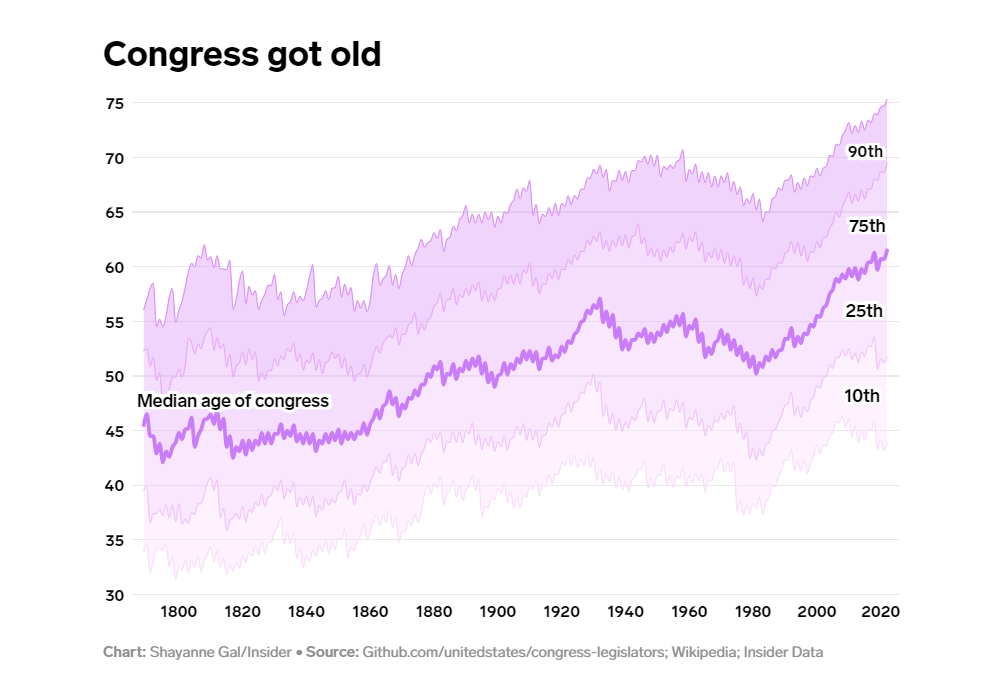
Aged 79, Joe Biden is the oldest sitting president in U.S. history. The median age of Congress has reached 61.5, an all-time record high.
Insider’s Annie Fu, Walt Hickey, and Shayanne Gal plotted the aging political leadership in a series of charts. The piece begins with a cool scrollytelling section that displays how federal judges and Congress have gotten older over time (starting from the dawn of the nation). It is followed by other interesting graphs.
Take a glance at this article on Insider.
***
Data Visualization Weekly roundups are out every Friday. Stay tuned to not miss the most topical and interesting charts and maps!
- Categories: Data Visualization Weekly
- No Comments »