 Treemap visualizations are widely used in hierarchical data analysis. If you need to build one but have never done that before, you might think the process is somewhat complicated. Well, not necessarily. I decided to make a step-by-step tutorial explaining how to create awesome interactive treemap charts with ease using JavaScript. And you’re gonna love the illustrations!
Are we alone in the universe? A question every one of us has asked ourselves at some point. While we are thinking about the odds of the Earth being the only habitable planet in the universe, or not, one of the things we might consider is how big the universe is. Let’s look at that with the help of treemaps! In this tutorial, we will be visualizing the scale of the 10 largest galaxies in the known universe using the treemapping technique.
So, would you like to know how to quickly build a JS-based treemap chart? Follow me in this stepwise tutorial and learn in an easy, fun way!
What Is Treemap?
Before we get down to the tutorial itself, let’s look at the concept of treemaps. A treemap chart is a popular technique for visualizing hierarchically organized, tree-structured data. Designed to show at a glance the structure of hierarchy along with the value of individual data points, it makes use of nested rectangles whose size is proportional to the corresponding quantities.
Each branch of the tree is a rectangle, and for sub-branches, there are smaller rectangles nested inside them. Displaying data by color and proximity, treemaps can easily represent lots of data while making efficient use of space and are great for comparing proportions within hierarchies.
The treemap chart type was invented by professor Ben Shneiderman who has given significant contributions in the field of information design and human-computer interaction. Treemaps are used in many data visualization areas and can be found applied in the analysis of stock market data, census systems, and election statistics, as well as in data journalism, hard drive exploration tools, etc.
A Peek at Our JS Treemap Chart
So now, we will build a treemap using JavaScript to compare the sizes of the top 10 galaxies in the known universe. Take a look at exactly what we are going to create. This is what our JS treemap chart will look like by the end of the tutorial.
Let’s start our interstellar journey!
Create a Basic JS Treemap Chart
Creating a JavaScript-based treemap chart generally takes four basic steps that are as follows:
- Create an HTML page
- Reference JavaScript files
- Set data
- Write some JS treemapping code
And don’t worry if you are a novice in HTML, CSS, and JavaScript. We will go through each and every step in detail, and by the end of this tutorial, you will have your own JS treemap ready.
So, the countdown has begun, let’s get our chart ready for launch.
1. Create an HTML Page
The first thing we do here is to create a basic HTML page. There, we add an HTML block element (<div>) — that’s where our treemap chart will be placed — and assign it an ID attribute (for example, let it be “container”) to reference it later in the code.
We should also set some styling for the <div>. Let’s define the width and height properties as 100% and margin and padding as 0. You may change this to your liking.
<!DOCTYPE html>
<html lang="en">
  <head>
    <meta charset="utf-8">
    <title>JavaScript Treemap Chart</title>
    <style type="text/css">
      html, body, #container {
        width: 100%;
        height: 100%;
        margin: 0;
        padding: 0;
      }
    </style>
  </head>
  <body>
    <div id="container"></div>
  </body>
</html>
2. Reference JavaScript Files
Next, we need to reference all the required scripts that will be used to create a treemap chart.
There are multiple JavaScript charting libraries out there to choose from. The fundamental steps of creating interactive data visualizations remain more or less the same with any of them. Here, for illustration, I am going to use AnyChart — it supports treemaps and has a free version, with the source open on GitHub.
So, to build a treemap chart, we need the ‘core’ and ‘treemap’ modules. Let’s reference both in the head section of the HTML page created in the first step. We will obtain them from the CDN (alternatively, the scripts can be downloaded).
<!DOCTYPE html>
<html lang="en">
  <head>
    <meta charset="utf-8">
    <title>JavaScript Treemap Chart</title>
    <script src="https://cdn.anychart.com/releases/8.11.0/js/anychart-core.min.js"></script>
    <script src="https://cdn.anychart.com/releases/8.11.0/js/anychart-treemap.min.js"></script>
    <style type="text/css">
      html, body, #container {
        width: 100%;
        height: 100%;
        margin: 0;
        padding: 0;
      }
    </style>
  </head>
  <body>
    <div id="container"></div>
  </body>
</html>
3. Set Data
Here comes the data. We will visualize the scale of the top 10 largest galaxies in the known universe. The galaxies are so incredibly vast that they’re measured by how many light-years across they are. A light-year is the distance a beam of light travels in a single Earth year, which equates to approximately 6 trillion miles.
I have already taken the galaxy scale data from Largest.org.
For our chart, the tree structure data will look as follows. The root-level element is ‘Galaxies,’ divided (by galaxy type) into ‘Elliptical’ and ‘Spiral’ as its children, which further have arrays of individual galaxy objects as their own children.
Each galaxy object is provided with key-value properties of name and scale in light-years. For example, {name: "IC 1101", value: 4000000} means the IC 1101 galaxy with its scale being 4,000,000 light-years. Honestly, it’s very hard to comprehend how massive it is.
var dataSet = [
  {name: "Galaxies", children: [
    {name: "Elliptical", children: [
      {name: "IC 1101", value: 4000000},
      {name: "Hercules A", value: 1500000},
      {name: "A2261-BCG", value: 1000000},
      {name: "ESO 306-17", value: 1000000},
      {name: "ESO 444-46", value: 402200},
    ]},
    {name: "Spiral", children: [
      {name: "Rubin's Galaxy", value: 832000},
      {name: "Comet Galaxy", value: 600000},
      {name: "Condor Galaxy", value: 522000},
      {name: "Tadpole Galaxy", value: 280000},
      {name: "Andromeda Galaxy", value: 220000}
    ]}
  ]}
];
4. Write Some JS Treemapping Code
Now, just a few lines of JavaScript code to fuel up our treemap chart.
First, we include the anychart.onDocumentReady() function, which will enclose all the JavaScript code of the treemap ensuring it will execute when the web page is fully loaded and ready.
<script>
  anychart.onDocumentReady(function () {
    // The JS treemapping code will be written here.
  });
</script>
Second, we add the data we want to visualize in a treemap chart, from step 3.
<script>

  anychart.onDocumentReady(function () {

    var dataSet = [
      {name: "Galaxies", children: [
        {name: "Elliptical", children: [
          {name: "IC 1101", value: 4000000},
          {name: "Hercules A", value: 1500000},
          {name: "A2261-BCG", value: 1000000},
          {name: "ESO 306-17", value: 1000000},
          {name: "ESO 444-46", value: 402200},
        ]},
        {name: "Spiral", children: [
          {name: "Rubin's Galaxy", value: 832000},
          {name: "Comet Galaxy", value: 600000},
          {name: "Condor Galaxy", value: 522000},
          {name: "Tadpole Galaxy", value: 280000},
          {name: "Andromeda Galaxy", value: 220000}
        ]}
      ]}
    ];

  });

</script>
Third, we add the following line to create a treemap from the tree data.
var chart = anychart.treeMap(dataSet, "as-tree");Finally, we add a title, put the chart in the previously defined <div> container, and display it using the draw command.
chart.title("The 10 Largest Galaxies in the Known Universe");
chart.container("container");
chart.draw();
Now our JS treemap is basically ready, and if we stopped at that, it would look something like this:
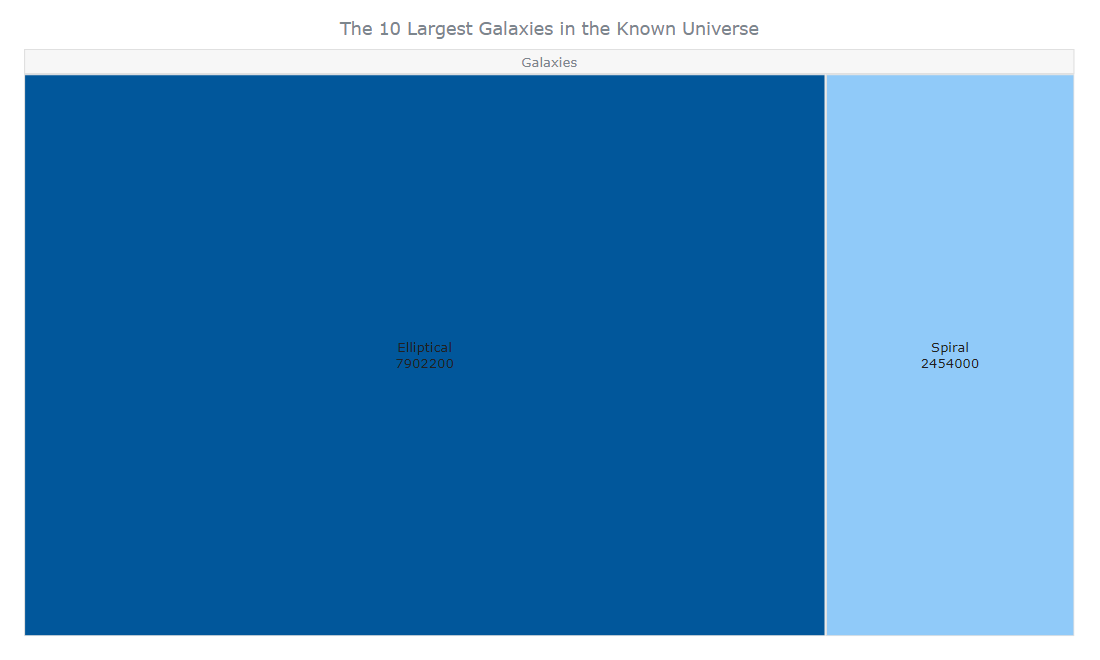
There are only two tiles visible immediately as the treemap chart is loaded, ‘Elliptical’ and ‘Spiral.’ We can click on those, and they will expand to show their respective children galaxies — that’s what is called a drill-down action.
Why is this happening, just two tiles? Because by default, the maximum depth value is set as 1. It means we can see only one level with its parent at a time. The lower levels are hidden. On the first level, we have ‘Galaxies’ being divided into ‘Elliptical’ and ‘Spiral,’ so we only see that by default.
Now, what do we do to display all the galaxy tiles at once? It’s very simple. We just need to change the maximum depth value using the maxDepth() function.
chart.maxDepth(2);The countdown is over, and our treemap chart is already now!
In this chart, we can see how the galaxies are grouped based on hierarchy, and we can also click on the ‘Elliptical’ or ‘Spiral’ headers at the top to zoom in on their children’s galaxies.
Look at the interactive version of this basic JavaScript treemap chart on JSFiddle [or AnyChart Playground]. Feel free to play around with it. You can also check out the full code below.
<!DOCTYPE html>
<html lang="en">
  <head>
    <meta charset="utf-8">
    <title>JavaScript Treemap Chart</title>
    <script data-fr-src="https://cdn.anychart.com/releases/8.11.0/js/anychart-core.min.js"></script>
    <script data-fr-src="https://cdn.anychart.com/releases/8.11.0/js/anychart-treemap.min.js"></script>
    <style type="text/css">
      html, body, #container {
        width: 100%;
        height: 100%;
        margin: 0;
        padding: 0;
      }
    </style>
  </head>
  <body>
    <div id="container"></div>

    <script>

      anychart.onDocumentReady(function () {

        // create the data
        var dataSet = [
          {name: "Galaxies", children: [
            {name: "Elliptical", children: [
              {name: "IC 1101", value: 4000000},
              {name: "Hercules A", value: 1500000},
              {name: "A2261-BCG", value: 1000000},
              {name: "ESO 306-17", value: 1000000},
              {name: "ESO 444-46", value: 402200},
            ]},
            {name: "Spiral", children: [
              {name: "Rubin's Galaxy", value: 832000},
              {name: "Comet Galaxy", value: 600000},
              {name: "Condor Galaxy", value: 522000},
              {name: "Tadpole Galaxy", value: 280000},
              {name: "Andromeda Galaxy", value: 220000}
            ]}
          ]}
        ];

        //  create the treemap chart and set the data
        var chart = anychart.treeMap(dataSet, "as-tree");

        // set the chart title
        chart.title("The 10 Largest Galaxies in the Known Universe");

        // set the container id for the chart
        chart.container("container");

        // initiate drawing the chart
        chart.draw();

      });

    </script>
  </body>
</html>
It was quite effortless to create a beautiful JavaScript treemap chart, wasn’t it? Now, you can see at a glance how the scale of the 10 largest galaxies looks and compare them.
The resulting chart already looks very good to me. But, let me show you how you can customize JavaScript treemaps whenever you want more.
Customize the JS Treemap Chart
Now, let’s add some aesthetic and functional changes to make our interactive treemap chart even better and more insightful.
A. Change Colors
An easy way to change the look and feel of any chart is to change the color to match the data we are representing. Here we are showing galaxies in the universe. When I think about the universe, I imagine the dark blue and purple clouds of stars in the dark space.
So, let’s change the color of the tiles. And let’s paint them purple. Also, let’s make them dark blue when selected.
chart.normal().fill('#B46FC2');
chart.hovered().fill('#44008B', 0.8);
chart.selected().fill('#0A0068', 0.8);
chart.selected().hatchFill("forward-diagonal", '#282147', 2, 20);
Here, we’ve added the fill() and hatchFill() methods to change the colors of our treemap chart.
B. Apply a Linear Color Scale
In treemaps, not only the size but also the color of the tiles can be helpful in highlighting the proportions. Let’s see a cool way to have the tiles automatically colored based on the corresponding data dimensions with the help of a linear color scale.
We create a linear color scale, provide it with two values, one for the lowest range value and the other for the highest, and finally, enable the color range.
var customColorScale = anychart.scales.linearColor();
customColorScale.colors(['#37B8F7', '#ffcc00']);
chart.colorScale(customColorScale);
chart.colorRange().enabled(true);
chart.colorRange().length('90%');
For these implementations to take place, we need to get rid of the code written in the previous section.
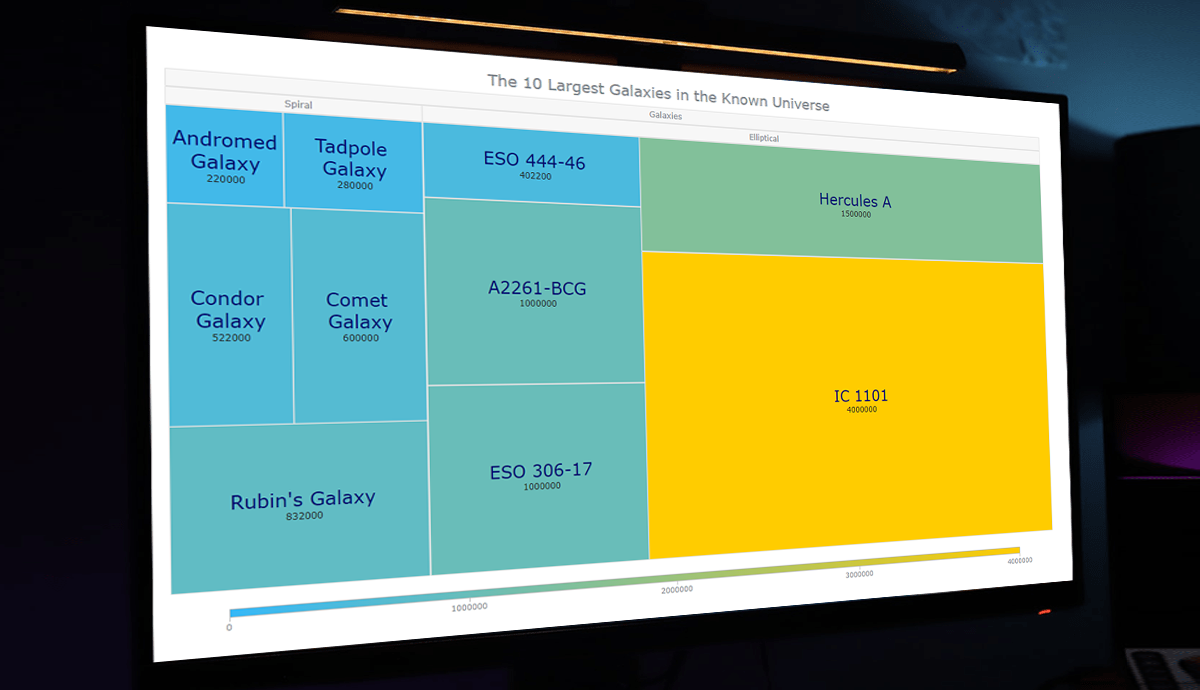
Here we have light blue for the lowest and yellow for the highest. Play along with the colors.
C. Format Labels and Tooltips
We can format our labels with the use of HTML. For that, we need to enable HTML for labels. Then there is no limit to how you can style them using HTML.
To keep it simple, we will format the labels as <span> HTML elements and style them to increase the font size and change the color.
chart.labels().useHtml(true);
chart.labels().format(
  "<span style='font-size: 24px; color: #00076f'>{%name}</span><br>{%value}"
);
As you can see in the code snippet above, we have also used the {%name} and {%value} tokens to change the text of treemap labels and tooltips. In this way, the name and the scale value will be output for each galaxy while creating the visualization.
In addition, let’s customize the text of the tooltip using the format() method. An informative tooltip can greatly help to understand the data better.
chart.tooltip().format(
  	"Scale: {%value} light-years"
);
Our JS-based treemap chart looks much enhanced with the label and tooltip formatting.
D. Sort Tiles in Ascending Order
By default, the treemap tiles are in descending order. We can see that the galaxies are sorted from highest to lowest, and the IC 1101 galaxy with the largest scale is the first from the left.
But that does not have to always be the case. Sometimes, we might need to show data in ascending order. Prepare yourself to be amazed to see how easy that is! We do that with one line of code.
chart.sort("asc");
Check out the whole code of this final interactive JavaScript treemap below [and also on AnyChart Playground]. Feel free to try some experimentation with it.
<!DOCTYPE html>
<html lang="en">
  <head>
    <meta charset="utf-8">
    <title>JavaScript Treemap Chart</title>
    <script data-fr-src="https://cdn.anychart.com/releases/8.11.0/js/anychart-core.min.js"></script>
    <script data-fr-src="https://cdn.anychart.com/releases/8.11.0/js/anychart-treemap.min.js"></script>
    <style type="text/css">
      html, body, #container {
        width: 100%;
        height: 100%;
        margin: 0;
        padding: 0;
      }
    </style>
  </head>
  <body>
    <div id="container"></div>

    <script>

      anychart.onDocumentReady(function () {

        // create the data
        var dataSet = [
          {name: "Galaxies", children: [
            {name: "Elliptical", children: [
              {name: "IC 1101", value: 4000000},
              {name: "Hercules A", value: 1500000},
              {name: "A2261-BCG", value: 1000000},
              {name: "ESO 306-17", value: 1000000},
              {name: "ESO 444-46", value: 402200},
            ]},
            {name: "Spiral", children: [
              {name: "Rubin's Galaxy", value: 832000},
              {name: "Comet Galaxy", value: 600000},
              {name: "Condor Galaxy", value: 522000},
              {name: "Tadpole Galaxy", value: 280000},
              {name: "Andromeda Galaxy", value: 220000}
            ]}
          ]}
        ];

        // create the treemap chart and set the data
        var chart = anychart.treeMap(dataSet, "as-tree");

        // set the chart title
        chart.title("The 10 Largest Galaxies in the Known Universe");

        // set a custom color scale
        var customColorScale = anychart.scales.linearColor();
        customColorScale.colors(['#37B8F7', '#ffcc00']);
        chart.colorScale(customColorScale);
        chart.colorRange().enabled(true);
        chart.colorRange().length('90%');

        // format the labels
        chart.labels().useHtml(true);
        chart.labels().format(
          "<span style='font-size: 24px; color: #00076f'>{%name}</span><br>{%value}"
        );

        // format the tooltips
        chart.tooltip().format(
          "Scale: {%value} light years"
        );

        // sort in ascending order
        chart.sort("asc");

        // set the container id for the chart
        chart.container("container");

        // initiate drawing the chart
        chart.draw();

      });

    </script>
  </body>
</html>
Conclusion
You might not have got the answer to the “Are we alone in the universe?” question. But you have learned to create awesome interactive JavaScript treemap charts effortlessly!
Now it’s your turn to build your own JS-based treemap chart visualization. See the treemap documentation to find out how anything else could be done in addition to what we’ve discussed in this tutorial, or apply the same logic with a different charting library, and certainly don’t hesitate to reach out to me if you need any further help (I’ll do my best).
The universe keeps expanding, and let it also be so with our learnings, knowledge, and creativity.
Published with the permission of Awan Shrestha. Originally appeared on DZone with the title “How to Build a Treemap Using JavaScript” on June 1, 2022.
You may also want to see the basic JavaScript Treemap Chart Tutorial originally published on our blog.
Check out other JavaScript charting tutorials.
- Categories: AnyChart Charting Component, HTML5, JavaScript, JavaScript Chart Tutorials, Tips and Tricks
- No Comments »