 Now it’s time for DataViz Weekly! Let’s look at the four most interesting new data visualization projects we have recently come across!
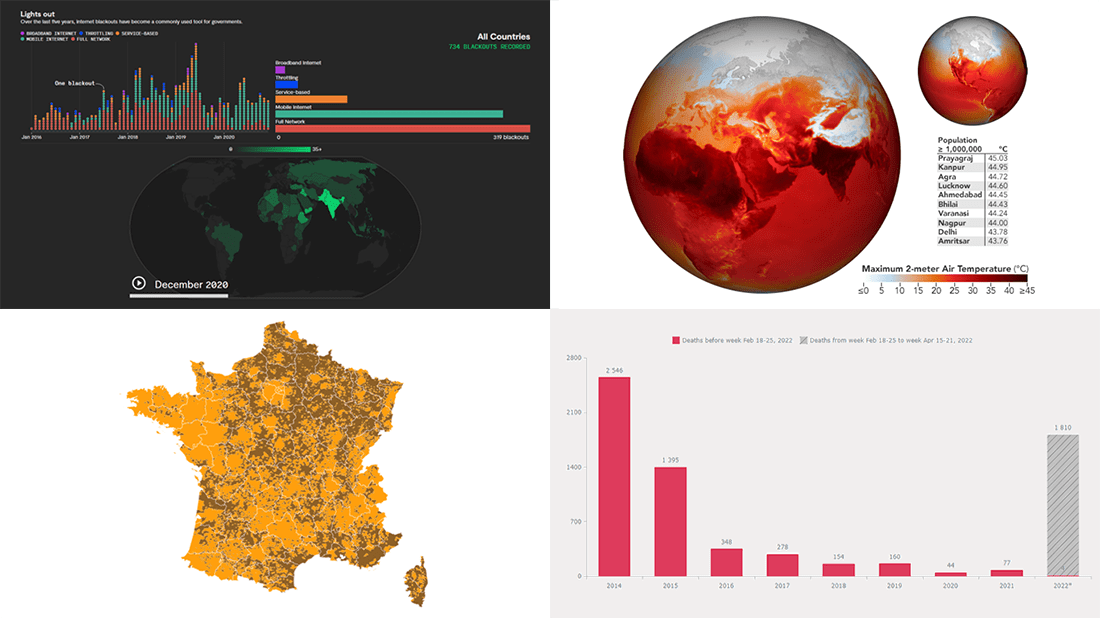
- Deaths in the (self-proclaimed) DPR in 2014–2022 — Reddit user feoleoneo
- French presidential election results — Le Monde
- Internet blackouts worldwide since 2016 — Rest of World
- April heat wave in India — Joshua Stevens, NASA Earth Observatory
Data Visualization Weekly: April 22, 2022 — April 29, 2022
Deaths in (Self-Proclaimed) Donetsk People’s Republic in 2014–2022
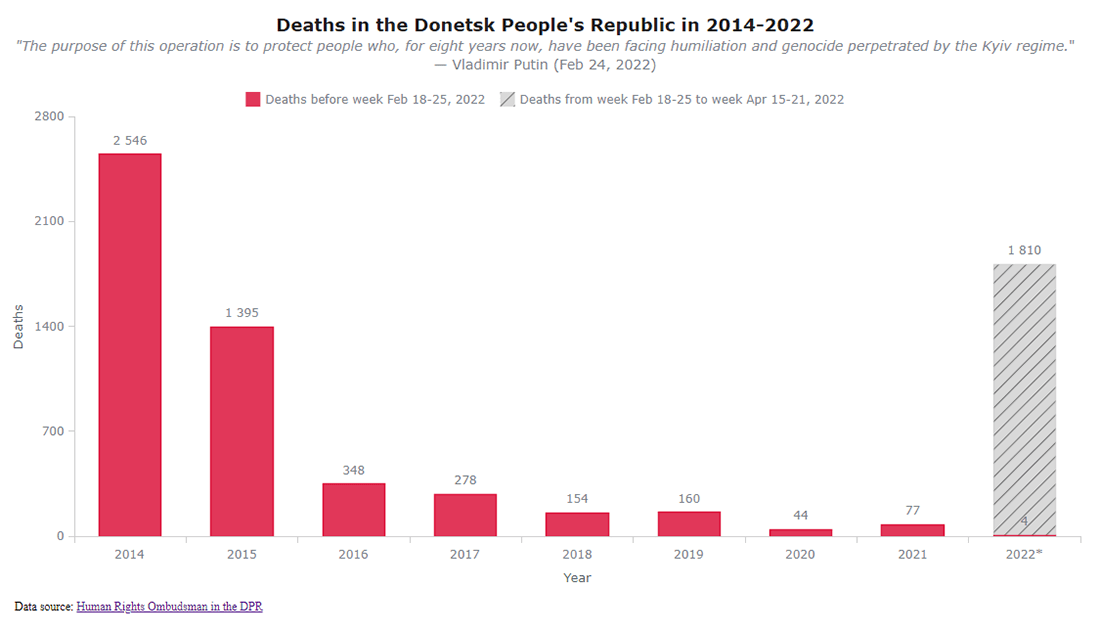
Over two months ago, on February 24, President of the Russian Federation Vladimir Putin announced a ‘special military operation’ against Ukraine. Calling the events in Donbas tragic, he articulated the purpose of the operation as ‘to protect people who, for eight years now, have been facing humiliation and genocide perpetrated by the Kyiv regime.’
Reddit user u/feoleoneo collated mortality data for the last eight years from the official reports of the Human Rights Ombudsman of the (self-proclaimed) Donetsk People’s Republic, one of the two breakaway regions in the Donbas currently recognized by Russia as independent states, and visualized it in a column chart. Each column marks the reported number of deaths of both civilians and servicemen ‘as a result of the conflict’ in one year, from 2014 when the conflict had begun. The 2022 column is divided into two parts, making it easy to see how many people died before and starting from the week of February 18–25.
Built using the AnyChart JavaScript library, the chart was shared in the r/dataisbeautiful subreddit on Monday and is still at the top. Its original interactive version with the full source code is available on AnyChart Playground.
French Presidential Election 2022 Results
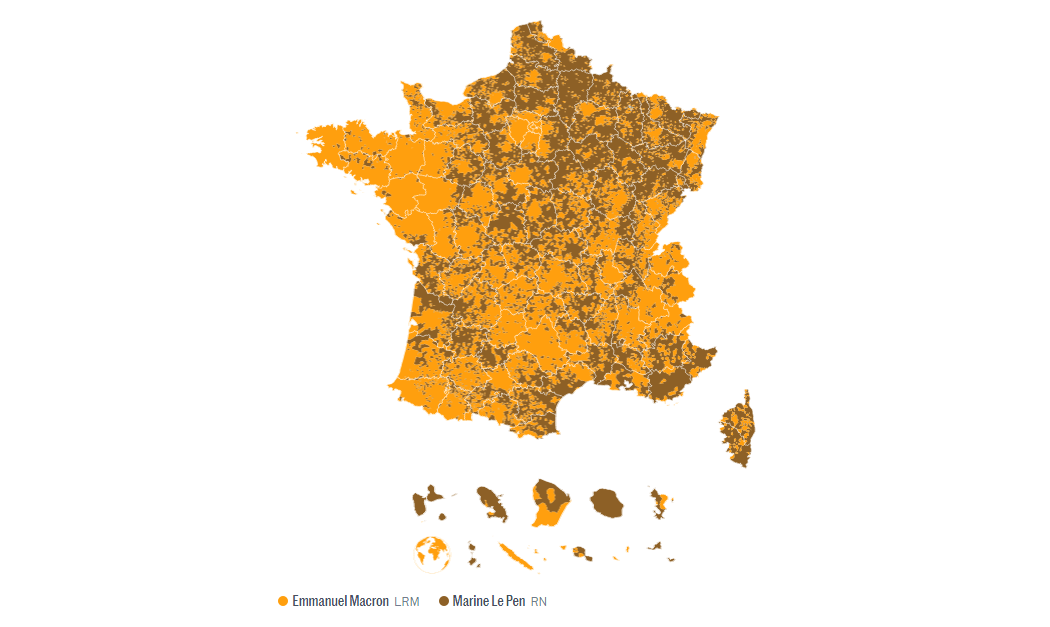
Last Sunday, centrist Emmanuel Macron was re-elected as the President of the French Republic. In the second round of the presidential election, he won 58.5% of the vote and beat far-right Marine Le Pen who got 41.5%.
You can explore the geographical breakdown of the results using one of many interactive maps out there. For example, Le Monde visualized the votes in granular detail. Its map displays the election results at the municipal level, with provinces won by Macron and Le Pen shaded in orange and brown, respectively.
Check out this map on Le Monde. There is also one representing the results of the first round in case you are interested.
Internet Blackouts Worldwide Since 2016
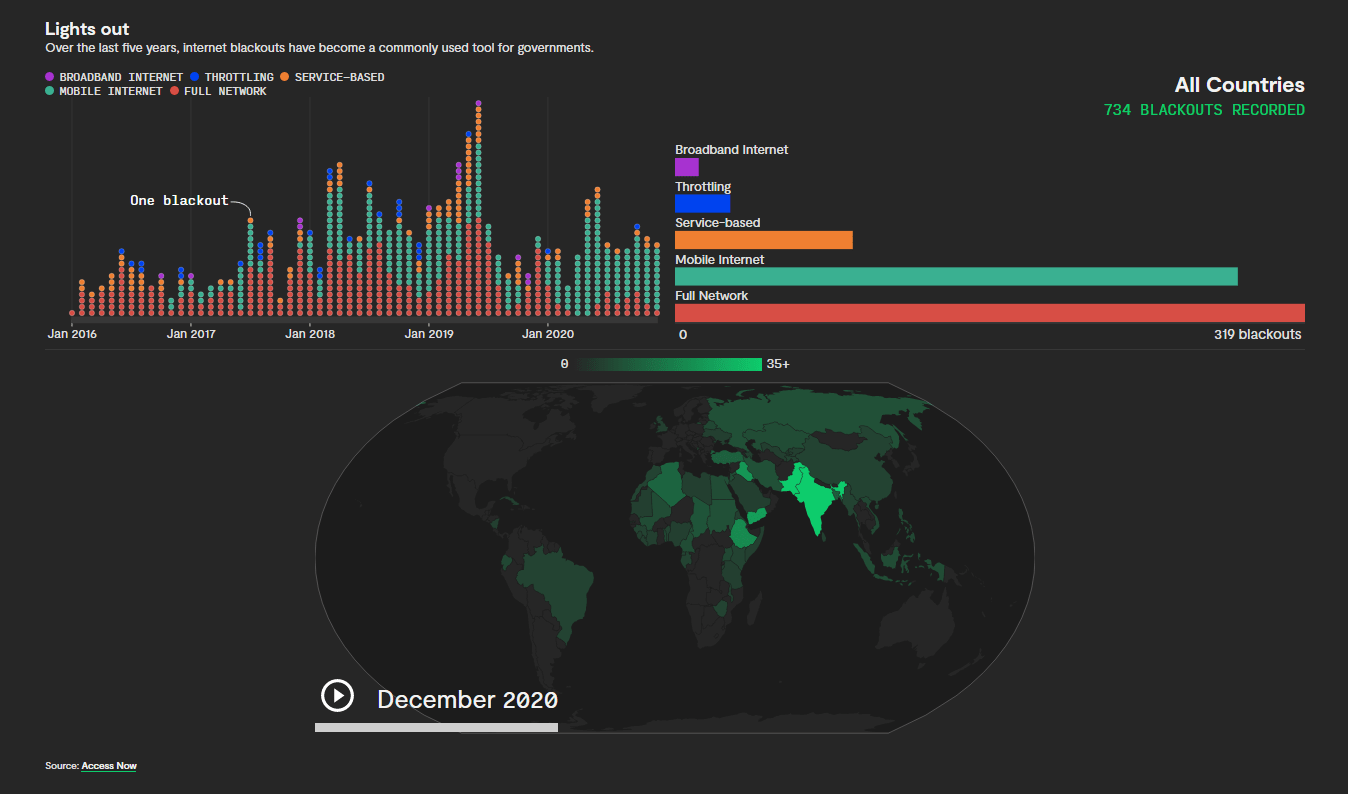
Internet shutdowns are now a common tool for authoritarian regimes all over the world to silence criticism. Access Now, a digital civil rights nonprofit, has identified hundreds of partial or total internet blackouts in over 60 countries since 2016. The vast majority of the shutdowns have taken place in the last 5 years.
Rest of World, a journalism nonprofit, took a deep dive into the growth and evolution of governments’ control over the internet. The resulting longread features an interactive visualization of Access Now’s data, which allows you to track the blackouts over time and geography.
See the story on the Rest of World website.
April Heat Wave in India
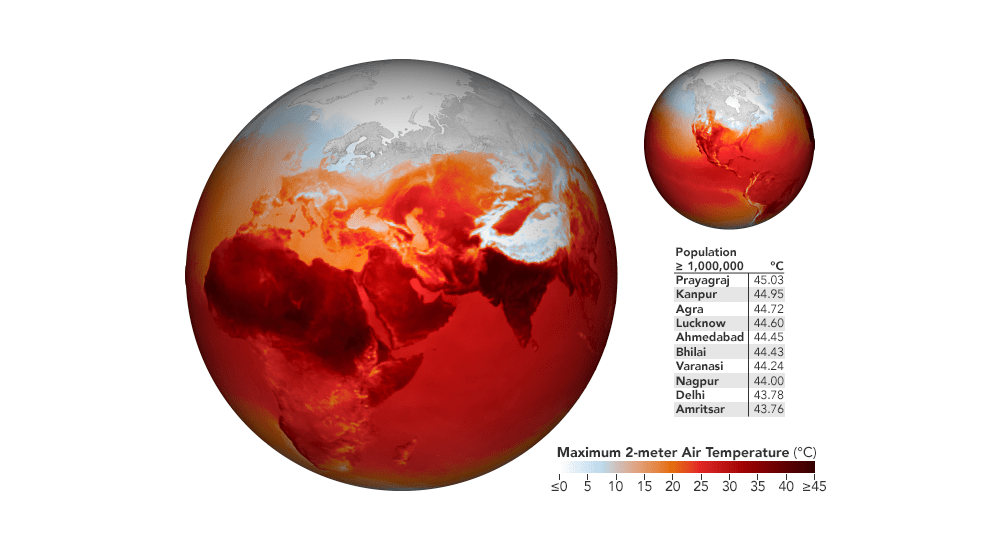
Following the hottest March ever on record, India has experienced more waves of extreme heat this month with air temperatures 8 to 15°F (4.5 to 8.5°C) above normal.
Joshua Stevens from NASA Earth Observatory mapped estimated air temperatures on April 27, at about 6.5 feet (2 meters) above the ground, based on the Goddard Earth Observing System (GEOS) model. The globe visualizations (pictured above) show far from India alone. So, it is also possible to see temperature levels in other regions of the world.
Take a closer look and learn more on the website of NASA Earth Observatory.
***
Stay tuned for Data Visualization Weekly! All the best!
- Categories: Data Visualization Weekly
- No Comments »