 A calendar chart is an effective way to represent activity over time graphically. It can nicely display how a quantity varies with the days, weeks, months, and years. If you want to learn to build stylish interactive calendar charts easily using JavaScript, welcome to my step-by-step tutorial!
To make this guide not only educating but also entertaining, I decided to reproduce GitHub’s calendar graph and visualize the repository contribution activity of Mike Bostock, a prominent computer scientist known globally as one of the creators of the open-source JavaScript charting library D3.js and of the interactive data visualization development platform Observable. So, we’ll also get a telling picture of how he performed in that regard!
Calendar Chart That Will Be Created
Before anything else, let me get you all pumped up by demonstrating the beautiful JavaScript-based calendar chart of Mike Bostock’s contributions that will be created along this tutorial. Read on to see how it’s built!
Basic Interactive JS Calendar Chart
An interactive JavaScript calendar chart can look a bit complex. But just follow these basic four steps, and you’ll be able to build one quite easily.
- Create an HTML page.
- Add the required JS files.
- Include the data.
- Add some JavaScript charting code.
1. Create an HTML page
Let’s start with the very basics and create an HTML page to render our JS calendar chart.
On this page, add a div element with a unique id attribute so that it can be easily referred to in the code later.
For the full-page rendering of the chart, set the width of the div as 100%. You may change this to your liking, of course.
<html>
  <head>
    <title>JavaScript Calendar Chart</title>
    <style type="text/css">
      html, body, #container {
        width: 100%; margin: 0; padding: 0;
      }
    </style>
  </head>
  <body>
    <div id="container"></div>
  </body>
</html>
2. Include the required JavaScript files
The quickest and most convenient way to create a calendar graph for the web is using a JavaScript charting library that supports this type of data visualization out of the box.
In this tutorial, we will use AnyChart as an example, and the visualization will be built following its calendar chart documentation. This library is free for non-commercial use and has many examples for the various chart types and options. So if you are a beginner, it still looks good for you to start.
Include the required JS files in the <head> section of the HTML page. Let’s take them from the CDN this time, but you can also download them if you want.
AnyChart has an inherent modular system. We need two charting modules to create a calendar chart: core and calendar.
<html>
  <head>
    <title>JavaScript Calendar Chart</title>
    <script src="https://cdn.anychart.com/releases/8.11.0/js/anychart-core.min.js"></script>
    <script src="https://cdn.anychart.com/releases/8.11.0/js/anychart-calendar.min.js"></script>
    <style type="text/css">
      html, body, #container {
        width: 100%; margin: 0; padding: 0;
      }
    </style>
  </head>
  <body>
    <div id="container"></div>
    <script>
      // The JS calendar chart code goes here.
    </script>
  </body>
</html>
3. Procure and add the data
Now, let’s see how to set the data for our calendar chart.
It is easy to retrieve data on the contributions of any GitHub user — we are looking at Mike Bostock in our case — via the GitHub GraphQL API.
I have already downloaded it and put it in the appropriate form in a JSON data file here.
To load this file in a straightforward manner, we can use the Data Adapter. Therefore, it needs to be referenced in the <head> section of our HTML page together with the other scripts we will use to create the calendar chart.
<script src="https://cdn.anychart.com/releases/8.11.0/js/anychart-data-adapter.min.js"></script>We have all the preparation done now, so let’s get on to the JS coding part. You will not believe how just a few lines will create a functional interactive calendar chart very quickly!
4. Add the JS charting code
To ensure that the charting code is executed only when the web page is ready, we must enclose it in the anychart.onDocumentLoad() function.
Inside, first, load the JSON data file using the data.loadJsonFile function.
Then, create a function with the data parameter, define a dataset variable to store the data, map the data, and pass the mapped data to the calendar() function.
anychart.onDocumentReady(function() {

  // load the json file
  anychart.data.loadJsonFile(
    'https://gist.githubusercontent.com/shacheeswadia/56f3867eb6f8fcc4532e7ac458c8d9f7/raw/702f30b457cc1b573093c6977a69958fb741ede6/calendarData.json',

    // create a function with the data parameter
    function(data) {

      // define a dataset variable to store the data
      var dataset = anychart.data.set(data);
      // map the data
      var mapping = dataset.mapAs({
        x: 'date',
        value: 'level'
      });

      // pass the mapped data to the calendar function
      var chart = anychart.calendar(mapping);

    }

  );

});
Let’s set the height of our calendar chart dynamically based on its actual value, which will enable scrolling in case the chart’s height is greater than the page’s.
chart.listen('chartDraw', function() {
  document.getElementById('container').style.height = chart.getActualHeight() + 'px';
});
Lastly, we add a title to make it clear for everyone what is visualized, set the container reference, and draw the resulting chart.
chart.title("GitHub Contributions of Mike Bostock in 2017–2021");
chart.container('container');
chart.draw();
That’s all we need to do to get an interactive JavaScript-based calendar chart created! Check out this initial version on AnyChart Playground.
Don’t you think this calendar chart looks cool? We can see that Mike Bostock had a huge number of contributions every year, especially in 2017 and 2021. Such an inspiration to code and create more in this new year 2022!
Advanced Interactive JS Calendar Chart
It was quite simple and fast to have the basic interactive calendar chart ready. But that’s not all. We can easily customize it to modify the look and feel.
So, let’s make this piece of data visualization even more elegant!
1. Color customization
If you look at the contributions graph on GitHub, it uses shades of green to represent the number of contributions made to repositories on a single day. We can try to replicate this look.
Define a custom color scale and set it to render those colors. The color legend can be hidden since the colors represent the ones commonly used for GitHub contributions. Plus, let’s make it all look as in the night theme and add a dark background.
// specify the color of the background
chart.background('#0d1117');

// configure a custom color scale
var customColorScale = anychart.scales.ordinalColor();
customColorScale.ranges([
  {equal: 1, color: '#0D4428'},
  {equal: 2, color: '#006D31'},
  {equal: 3, color: '#37AB4B'},
  {equal: 4, color: '#39D353'}
]);

// set the custom color scale
chart.colorScale(customColorScale);

// hide the color legend
chart.colorRange(false);
2. Stroke, spacing, other aesthetic changes
We can actually do even better making our chart’s design even more similar to the GitHub contributions calendar graph.
First, remove the month separation line.
Second, adjust the spacing and the stroke for the day tiles and also change the color of those with no data to visually blend it with the background.
// remove the stroke
chart.months()
  .stroke(false)
  .noDataStroke(false);

// set the spacing and other options
chart
  .days()
  .spacing(4)
  .stroke(false)
  .noDataStroke(false)
  .noDataFill('#161b22')
  .noDataHatchFill(false);
Aha! This makes our JS calendar chart look just like GitHub’s original calendar chart! You can find the interactive version on AnyChart Playground, with its full HTML/CSS/JavaScript code.
3. Title and tooltip formatting
Let’s also make the title more striking by modifying the font size, weight, and color.
var title = chart.title();
title.enabled(true);
title
  .text("GitHub Contributions of Mike Bostock in 2017–2021")
  .fontSize(22)
  .fontWeight(500)
  .fontColor("#dfdfdf")
  .padding(10);
The default tooltip shows the level, a value that defines the color. But why not display the contribution value instead:
chart.tooltip()
  .format('{%contributionCount} contributions');
4. Configuring the order of years
I think it will be better to show more recent years higher. It is not a problem as the order of the years can be reversed very simply with just one line of code.
chart.years().inverted(true);Done! Take a look at this stunning JavaScript Calendar Chart. The interactive version with its complete code is on AnyChart Playground.
5. Final touch
And the cherry on top.
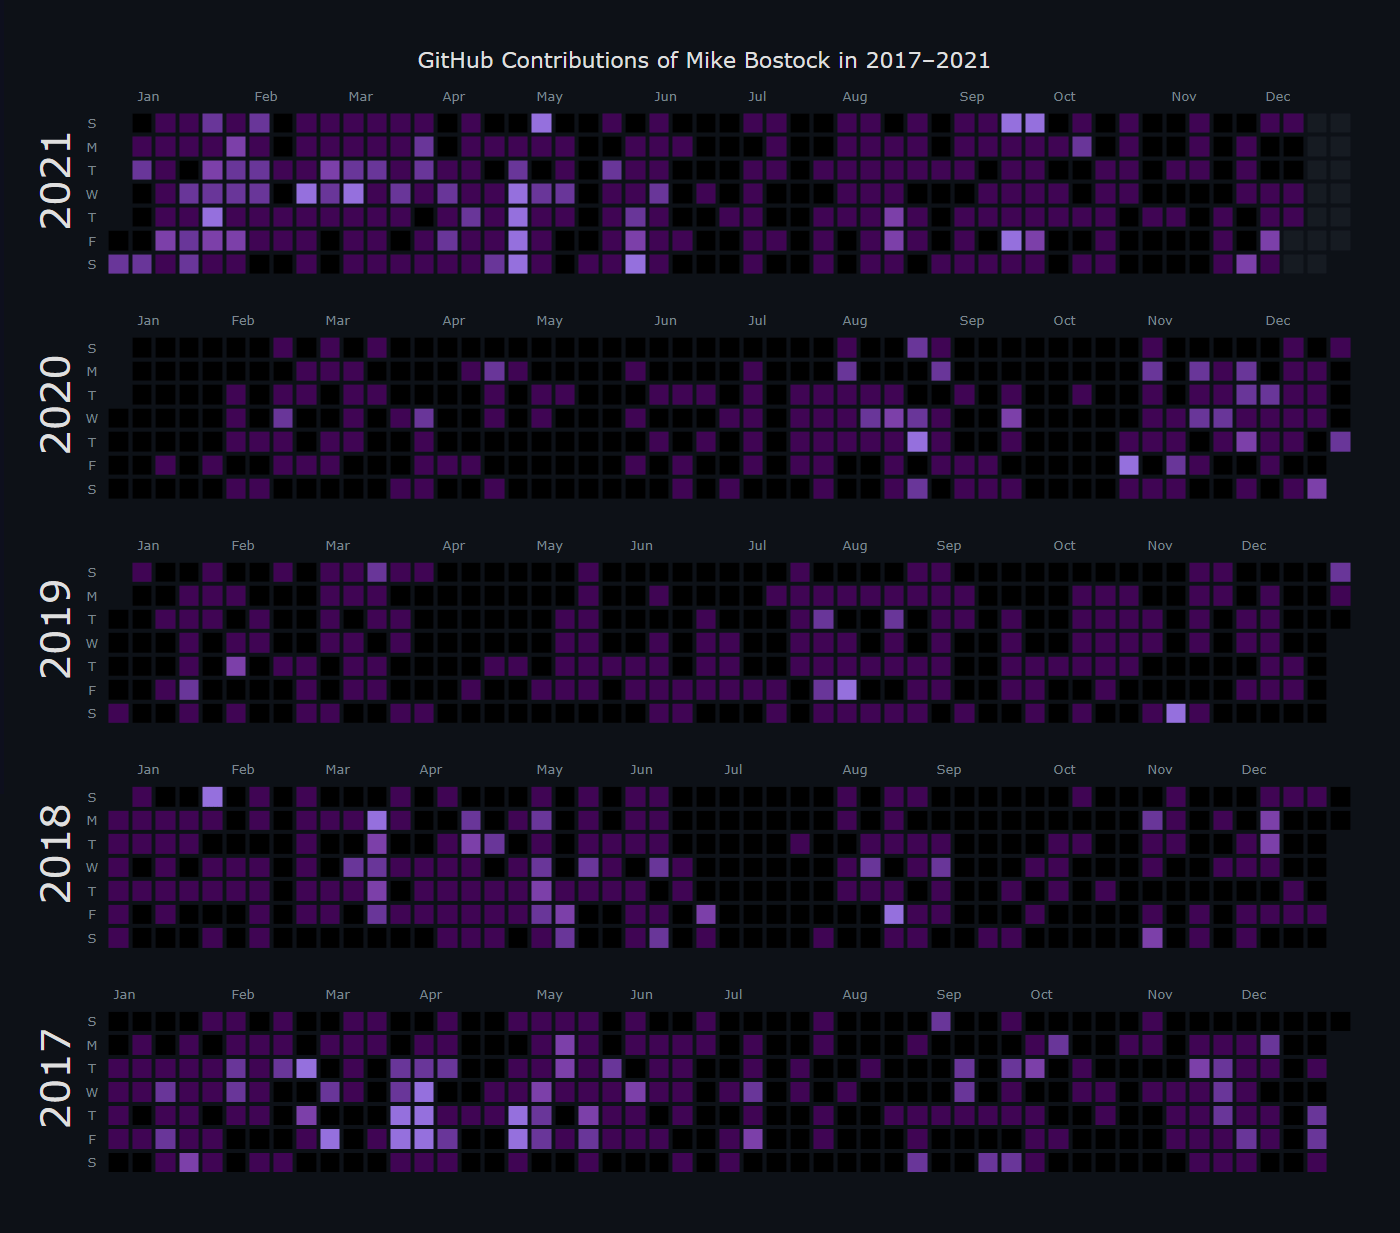
The classic GitHub calendar chart looks fantastic. But lastly, I decided to modify the color palette to make it all super chic.
var customColorScale = anychart.scales.ordinalColor();
customColorScale.ranges([
  {equal: 1, color: '#400554'},
  {equal: 2, color: '#693699'},
  {equal: 3, color: '#7c40a9'},
  {equal: 4, color: '#9570dd'}
]);
Take a glance at the final chart of this tutorial below. Then feel free to check out this interactive JS calendar graph of Mike Bostock’s GitHub contributions AnyChart Playground and to play around with the colors as you want!
Conclusion
To wrap it up, we’ve just seen how to make a seemingly complicated interactive JavaScript calendar chart quite effortlessly. Go ahead and create your own data visualization of this or a different chart type. Please feel free to ask me any questions or drop a suggestion.
As the new year has begun, let’s promise ourselves to create more amazing visualizations and make our GitHub contributions graph look fabulous as well!
AnyChart thanks freelance data designer Shachee Swadia for creating this amazing JavaScript Calendar Chart tutorial for our blog.
Don’t miss out on more cool JavaScript charting tutorials.
If you want to contribute a guest post, we look forward to hearing from you.
- Categories: AnyChart Charting Component, Big Data, HTML5, JavaScript, JavaScript Chart Tutorials, Tips and Tricks
- No Comments »