 Hey guys, check out new awesome graphics! We have come across these works just about now and decided to highlight them today in DataViz Weekly as really cool data visualization examples. See them now for fun and inspiration!
- Human activity in the Belgian part of the North Sea — De Tijd
- Colors of Bob Ross’s TV artwork — Connor Rothschild
- Housing affordability in Australia — Aussie
- Jobs that tend to marry together — Nathan Yau
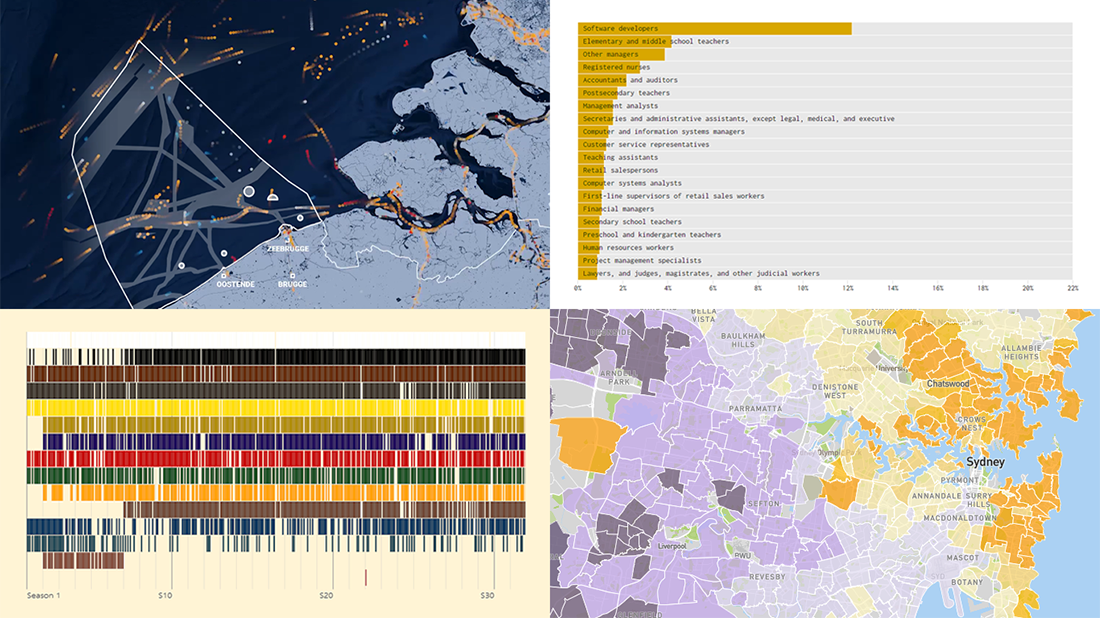
Data Visualization Weekly: May 21, 2021 — May 28, 2021
Human Activity in Belgian North Sea
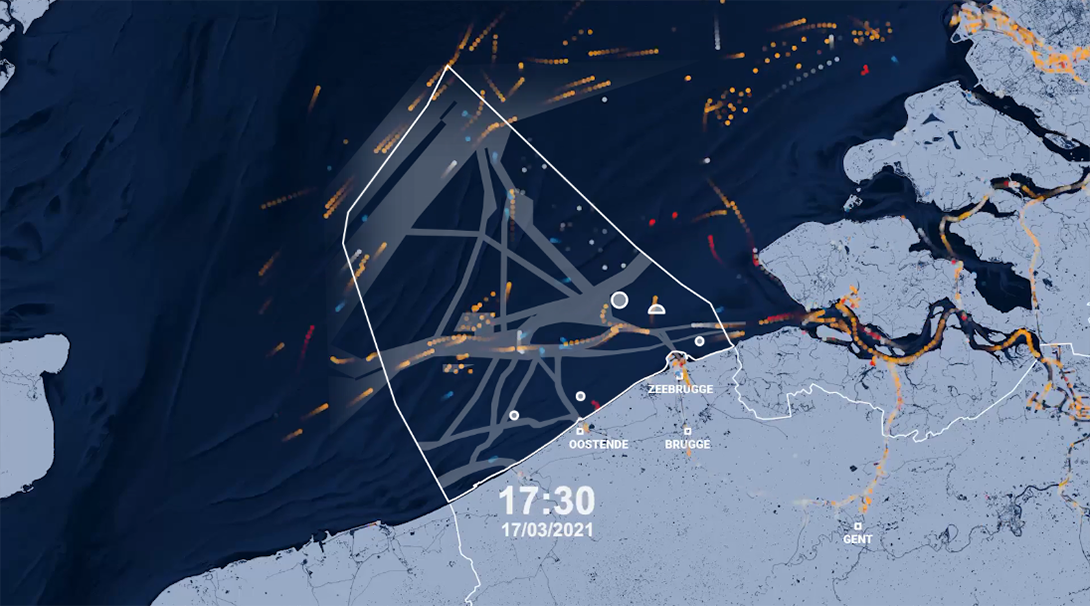
Belonging to the English Channel, the world’s busiest shipping area, the Belgian North Sea is extremely crowded. And the amount of human activity there only gets bigger.
De Tijd, a Belgian financial daily, made a stunning animated map to provide a look at how busy the sea off the coast of Belgium is. Based on data from MarineTraffic, the visualization illustrates all the shipping traffic in the area during one day. Colored dots are used to mark different vessel types: orange for container ships, blue for fishing boats, red for dredgers, and gray for others. As you scroll down the story that accompanies the map explaining the most important and interesting facts, more information appears such as routes, sandbanks, and dredging dumps.
After the animation, other marine activity zones are also mapped: wind farms, protected natural areas, pipes, and more. Underwater noise pollution displayed in a separate visualization is another interesting graphic to check out.
Colors of Bob Ross TV Artwork
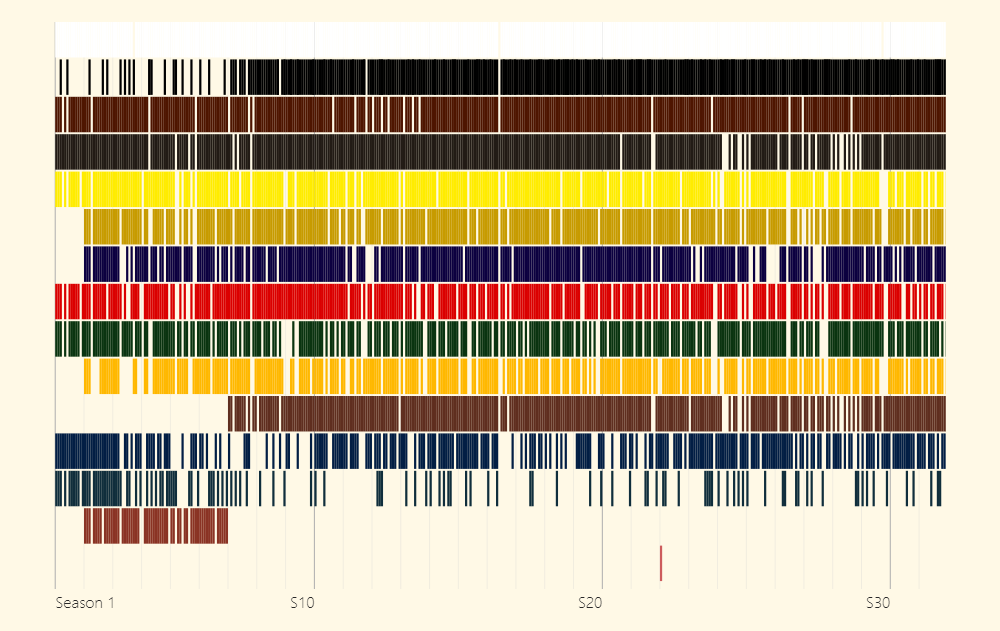
The Joy of Painting, an instructional TV show created and hosted by Bob Ross, an American painter, used to be famous not only in the U.S. but also far beyond. So, many if not all of you have at least heard of it. During each episode, he created a painting and explained the techniques.
Bob Ross generally used a limited number of colors. Connor Rothschild, a data scientist and web developer, decided to take a closer look at them. Using Jared Wilber’s database with information about all the 403 paintings made during The Joy of Painting, he charted the colors from those works. The resulting project is an impressive virtual art gallery that lets you take a tour of the TV paintings of Bob Ross through the lens of palette.
Find out how many colors Ross used in each painting, what they are, which ones appear in his TV artwork most frequently, and learn even more. Great project indeed.
Housing Affordability Across Australia
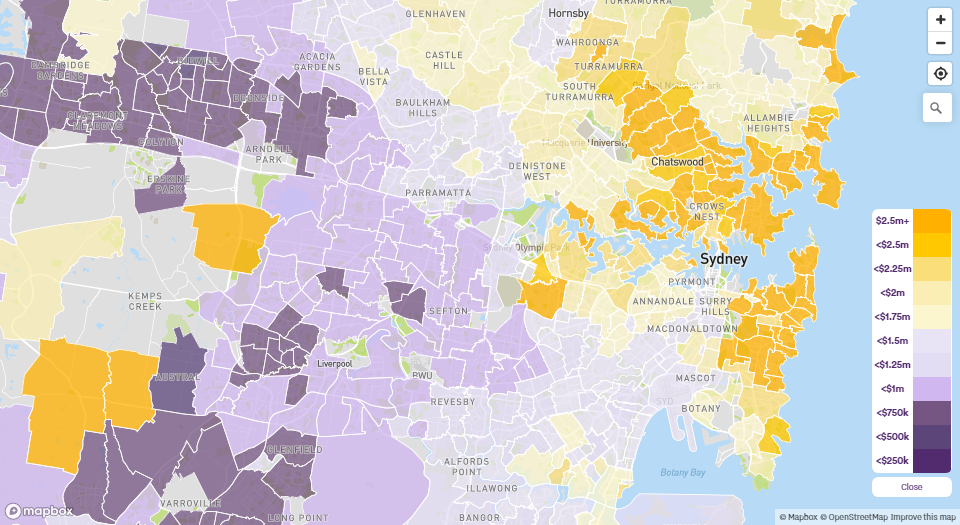
Dwelling prices in Australia’s capital cities continue to surge. In Sydney, for example, if you do not have savings of more than $100,000 and want to buy a house with 20% down, you can only choose from six suburbs. All of them are situated over twenty miles away from the city center. With the same deposit, no homes in Canberra are available to purchase at all.
To help prospective buyers find suburbs where they can afford to get a house, mortgage broker company Aussie launched a special interactive map. Visualizing data from property analytics group CoreLogic, the map displays median prices for houses and apartment units across the country. But what makes it stand out as a really helpful tool is the opportunity to understand the deposit amounts required in the desired locations as well as to filter out the suburbs that do not fit certain criteria for an affordable down payment.
Check out Aussie’s Suburb Spotter and navigate the Australian property market with ease.
Jobs That Tend to Marry Together

Fate is not the only thing that brings two people together. Sometimes it is (also) their jobs. At least statistics reveal that occupation may serve as an indicator of how well certain people match together.
Nathan Yau visualized data from the American Community Survey and in this way shed light on this. A simple bar chart tool he created provides a straightforward way to identify what jobs most commonly pair together, among the married couples in the U.S. And it indeed appears that people often marry someone with the same occupation (or working in the same industry). That especially is the case for physicians. Similar patterns are true for lawyers, chiropractors, software developers, and many, many others.
Enter a job title and find out who these people marry most often and how others rank. You can also try some random occupations. In 2017, Nathan Yau made another cool data visualization project providing a bit different view of similar, yet older data — see his Occupation Matchmaker if you missed it.
***
Go ahead and check out these cool projects right away! And stay tuned for Data Visualization Weekly!
- Categories: Data Visualization Weekly
- No Comments »