 Almost recovered from COVID-19 myself these days, I decided to explore how the world is currently doing, during the pandemic. So I created a sunburst chart to see at a glance what continents and countries are more (and less) affected by the coronavirus than others. The process was quick and I thought someone could be interested to learn about how such data visualizations can be built in a pretty straightforward way, even with very little technical skills. So I also made a tutorial. And here I am — (1) sharing my interactive sunburst chart of COVID cases and (2) describing how I created it using JavaScript in a matter of minutes, step by step!
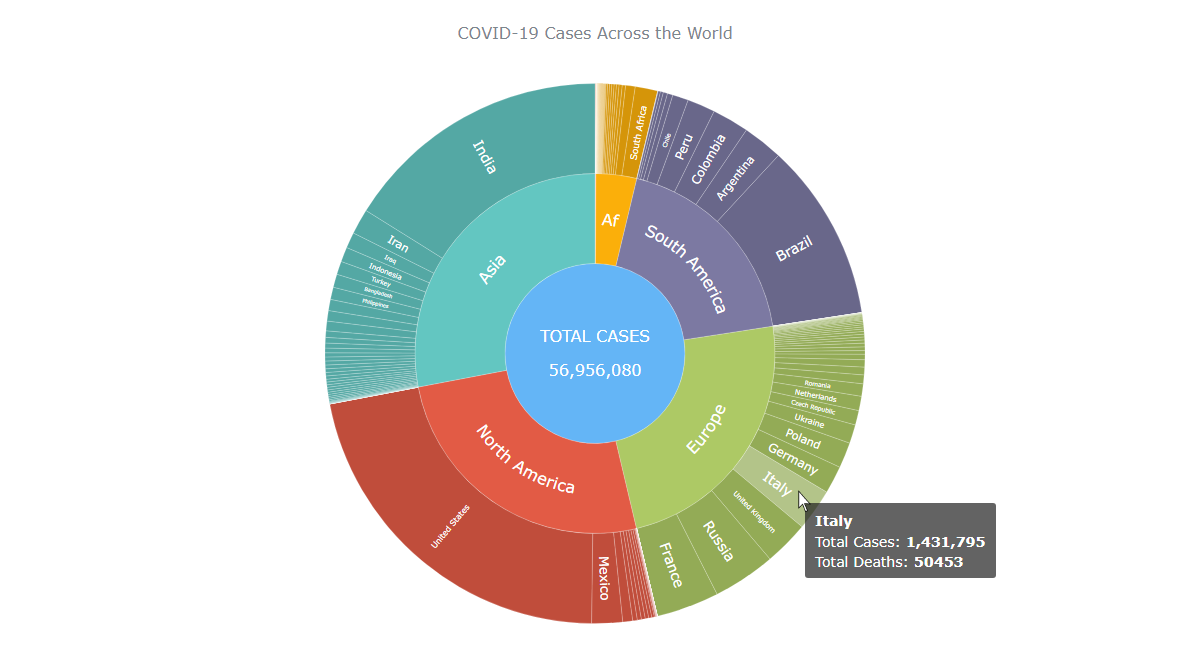
My JS sunburst chart provides an overview of the situation as of November 24, 2020, and also shows the global count, continent-wide data, and country-wise proportions for the current active COVID-19 cases and deaths. Scroll down to explore it by yourself and check out the tutorial along the way. Here is a sneak peek of the final chart to get you excited:
This sunburst charting tutorial is mainly for beginners to data science. So before we get to business, let’s make sure we’re on the same page. I’ll explain what a sunburst chart is and how it works, to start with. Then I’ll show you how to create a cool and colorful interactive visualization like that with JavaScript (and you can do it even if you don’t know it too well). That’s the plan!
What Is a Sunburst Chart?
A sunburst chart shows hierarchy through a series of rings. Each ring is segmented proportionally to represent its constituent details and corresponds to a level in the hierarchy, with the central circle representing the root node and the hierarchy moving outwards from it.
A Sunburst is remarkably similar to a Treemap, except that it uses a radial rather than a rectangular layout.
Sunburst charts are also called ring charts, multilevel pie charts, or treepies. They are best suited to represent part of whole relationships. The hierarchy of the categories is ideally represented by a uniform color palette, thereby giving a clear understanding of the lineage. Each level can be clicked to get a drilled-down view of that category.
Without further ado, let’s see how to make them with ease, illustrated by the example of COVID statistics as data and JavaScript (HTML5) as a technology.
Building a JS Sunburst Chart
When you’re visualizing data for an online project like a web site, it is always an advantage to have at least some programming skills. But there are multiple solutions such as JavaScript charting libraries that can make it quite effortless to create beautiful charts at a fast pace — even graphics like sunburst diagrams that may look quite complicated — without too much technical knowledge and experience. Look.
To start with, the entire process of making an interactive JS sunburst chart — or basically any JavaScript chart — can be logically split into four fundamental steps. They are as follows:
- Create a basic HTML page (if you don’t have it yet).
- Include the necessary JavaScript files (such as the charting library scripts).
- Connect the data (what dataset are you going to visualize?).
- Add some simple JS code (depending on what kind of chart you want to get).
1. Create an HTML page
The first thing to do is make a basic HTML page with a head and a body to render the visualization. Here, it is also necessary to add a div element that will contain the chart and give it some id to easily reference this div in any other places within the code.
<!DOCTYPE html>
<html>
  <head>
    <title>JavaScript Sunburst</title>
    <style type="text/css">
      html,
      body,
      #container {
        width: 100%;
        height: 100%;
        margin: 0;
        padding: 0;
      }
    </style>
  </head>
  <body>
    <div id="container"></div>
  </body>
</html>
You see the div block element is given a width and height of 100% to render the chart full screen. But you can change that to fit your requirements, of course.
2. Include JavaScript files
Second, reference all the necessary JS files in the <head> section of the HTML page.
Multiple JavaScript charting libraries can be used to quickly visualize data. Not all of them have sunburst charts, though. For this particular visualization, I decided to go with the JS library of AnyChart. It supports a sunburst and many useful features out of the box, and also has detailed documentation with a lot of samples. The same basic steps usually apply if you use a different charting library, though, anyway.
I will include the corresponding files from AnyChart’s CDN; you can download these files locally if you wish. In particular, I need to add the core library module that is necessary for all types of charts and a specific module for the sunburst chart.
<!DOCTYPE html>
<html>
  <head>
    <title>JavaScript Sunburst</title>
    <script src="https://cdn.anychart.com/releases/8.9.0/js/anychart-core.min.js"></script>
    <script src="https://cdn.anychart.com/releases/8.9.0/js/anychart-sunburst.min.js"></script>
    <style type="text/css">
      html,
      body,
      #container {
        width: 100%;
        height: 100%;
        margin: 0;
        padding: 0;
      }
    </style>
  </head>
  <body>
    <div id="container"></div>
    <script>
      // All the JS code for the sunburst chart will come here.
    </script>
  </body>
</html>
You see I included a script tag in the body for adding the JavaScript code for the sunburst chart, which will be figured out in the last step.
3. Connect the COVID data
Since COVID-19 is a globally topical issue, there are tons of datasets available for it. I wanted to focus on the total number of confirmed cases and deaths due to COVID-19 across the various countries of the world. Finally, I decided to take the data from a trusted source — Our World in Data, a scientific online publication whose researchers are based at the University of Oxford.
I downloaded the complete dataset in the JSON format and then filtered the data to keep only relevant information for the chart. Since the dataset is quite big, I store it in a separate file and will reference that file in my HTML page to apply it to the sunburst graphic type in this case.
Loading the JSON file in AnyChart can be done with the help of the Data Adapter module, which needs to be referenced in the <head> section in addition to the library’s scripts included in the previous step. Next, the loadJsonFile method is used inside the <script> tag in the body of the HTML page to load the data file.
<!DOCTYPE html>
<html>
  <head>
    <title>JavaScript Sunburst</title>
    <script src="https://cdn.anychart.com/releases/8.9.0/js/anychart-core.min.js"></script>
    <script src="https://cdn.anychart.com/releases/8.9.0/js/anychart-sunburst.min.js"></script>
    <script src="https://cdn.anychart.com/releases/8.9.0/js/anychart-data-adapter.min.js"></script>
    <style type="text/css">
      html,
      body,
      #container {
        width: 100%;
        height: 100%;
        margin: 0;
        padding: 0;
      }
    </style>
  </head>
  <body>
    <div id="container"></div>
    <script>
      anychart.data.loadJsonFile('{JSON data file location}',
        function (data) {
          // Sunburst chart's JS code will come here.
      });
    </script>
  </body>
</html>
Now that the structure required to hold the chart and the data is ready, let’s add just a handful of quick lines of JavaScript code and see a magnificent sunburst chart materialize!
4. Add JS code for the sunburst diagram
Before anything else, I’ll add a function enclosing all the JavaScript code for my sunburst chart of the COVID data, which makes sure that the entire code inside of it will only execute once the page is ready.
Since sunburst charts feature a tree structure, firstly it’s necessary to create that structure from the data and then use it to make the chart. Next, I set the calculation mode as “parent-independent” which is used to compare elements by their values. Also, I am dealing with numeric data and I will sort it in ascending order.
Do not worry if all this sounds complicated or difficult to grasp. In fact, it is extremely easy here — look at how it’s done in just 4 additional lines of code (I’ll leave comments to each so you’ll see):
<script>
  anychart.onDocumentReady(function() {
  anychart.data.loadJsonFile('{JSON data file location}',
    function (data) {
      // create a data tree from the dataset
      var dataTree = anychart.data.tree(data);
      // create a sunburst chart
      var chart = anychart.sunburst(dataTree);
      // set the calculation mode
      chart.calculationMode('parent-independent');
      // set the ascending sort order
      chart.sort('asc');
    });
  });
</script>
Now, I’ll add a chart title and set the container referencing the id given to the HTML element in step 1. The final action is to draw the sunburst chart we’ve just coded.
// set the chart title
chart.title("COVID-19 Cases Across the World");
// set the chart container element id
chart.container('container');
// initiate chart drawing
chart.draw();
Voilà! A basic, yet already fully-functional and lovely-looking JavaScript-based sunburst chart is ready! Check it out below embedded from CodePen AnyChart Playground where you can play with the code. (But keep reading as this is just the beginning!)
Customizing the Sunburst Chart
The basic JS sunburst chart I’ve created is already cool. But I decided to improve it a little bit in a few quick moves to make it more engaging. Join me on it.
A. Improve the tooltip format
Let’s format the tooltip to add the thousands separator for better comprehensibility and include the number of deaths along with the number of cases for each region.
chart.tooltip().format('{%name}: \n Total Cases: {%value}{groupsSeparator:\\,} \n Total Deaths: {%total_deaths}');B. Change colors
It is always a good idea to fine-tune the colors for a touch of personalization. Instead of simply changing the palette from the defaults to some other pre-defined one, I decided to set colors in a custom way. Since I want the colors assigned according to the data, I can add the desired colors in the dataset itself by adding a fill property in the data for each continent. The updated data file is here.
{
"name": "Asia",
"fill": "#63c6c1"
}
Note that we do not even need to add any other code to our HTML file in this case!
Check out my chart with these two quick modifications:
C. Labels and Tooltip Formatting
Then, I will modify the labels of the continent level to show only the names for a cleaner look. I’ll also format the label and tooltip look some more to make it all appear a bit more refined in my sunburst chart.
// enable HTML in labels
chart.labels().useHtml(true);
// customize the format of the sunburst chart labels
chart
  .level(1)
  .labels()
  .fontFamily("Verdana, sans-serif")
  .format("<span style='font-size:16px'>{%name}</span>");
chart
  .level(0)
  .labels()
  .fontFamily("Verdana, sans-serif")
  .fontWeight(500)
  .format("<span style='font-size:16px'>TOTAL CASES</span><br><br><span style='font-size:16px'>{%value}{groupsSeparator:\\,}</span>");
// enable HTML in tooltips
chart.tooltip().useHtml(true);
// customize the format of the sunburst chart tooltip
chart
  .tooltip()
  .fontFamily("Verdana, sans-serif")
  .format("<h5 style='font-size:14px; margin: 0.25rem 0;'>{%name}</h5><h6 style='font-size:14px; font-weight:400; margin: 0.2rem 0;'>Total Cases: <b>{%value}{groupsSeparator:\\,}</b></h6><h6 style='font-size:14px; font-weight:400; margin: 0.2rem 0;'>Total Deaths: <b>{%total_deaths}{groupsSeparator:\\,}</b></h6>");
Check out the new look and the updated code for these formatting changes:
D. Fill and Stroke Effect
The sunburst chart already looked great, but I decided to add a final set of finishing touches to make it look even cooler. I darkened the colors for the 2nd level and reduced the stroke for each region to give a look of depth to the entire visualization.
// configure the chart stroke
chart.normal().stroke("#fff", 0.2);
// set the point fill
chart.fill(function (d) {
  return anychart.color.darken(this.parentColor, 0.15);
});
Here is my final interactive JavaScript sunburst chart ready and shining!
It provides a great way to explore the data about COVID-19 cases and deaths by continent and by country. (Click on a continent to drill down.)
For your convenience, just in case, you’ve got an image and the complete HTML/CSS/JS code below too.
<html>
<head>
  <title>JavaScript Sunburst</title>
  <script src="https://cdn.anychart.com/releases/8.9.0/js/anychart-core.min.js"></script>
  <script src="https://cdn.anychart.com/releases/8.9.0/js/anychart-sunburst.min.js"></script>
  <script src="https://cdn.anychart.com/releases/8.9.0/js/anychart-data-adapter.min.js"></script>
  <style type="text/css">
    html,
    body,
    #container {
      width: 100%;
      height: 100%;
      margin: 0;
      padding: 0;
    }
  </style>
  </head>
  <body>
    <div id="container"></div>
    <script>
anychart.onDocumentReady(function () {
anychart.data.loadJsonFile('https://gist.githubusercontent.com/shacheeswadia/3bbe6eb041166e259f1712e6766fa5a2/raw/341d2796dd63e6e6defc1ec52dd4e73c7828c38c/sunburstDataUpdated.json',
  function (data) {
    // create a data tree from the dataset
    var dataTree = anychart.data.tree(data);

    // create a sunburst chart
    var chart = anychart.sunburst(dataTree);
    // set the calculation mode
    chart.calculationMode('parent-independent');
    // set the ascending sort order
    chart.sort('asc');
    // set the chart title
    chart.title("COVID-19 Cases Across the World");

    // enable HTML in labels
    chart.labels().useHtml(true);
    // customize the format of the sunburst chart labels
    chart
      .level(1)
      .labels()
      .fontFamily("Verdana, sans-serif")
      .format("<span style='font-size:16px'>{%name}</span>");
    chart
      .level(0)
      .labels()
      .fontFamily("Verdana, sans-serif")
      .fontWeight(500)
      .format("<span style='font-size:16px'>TOTAL CASES</span><br><br><span style='font-size:16px'>{%value}{groupsSeparator:\\,}</span>");
    // enable HTML in tooltips
    chart.tooltip().useHtml(true);
    // customize the format of the sunburst chart tooltip
    chart
      .tooltip()
      .fontFamily("Verdana, sans-serif")
      .format("<h5 style='font-size:14px; margin: 0.25rem 0;'>{%name}</h5><h6 style='font-size:14px; font-weight:400; margin: 0.2rem 0;'>Total Cases: <b>{%value}{groupsSeparator:\\,}</b></h6><h6 style='font-size:14px; font-weight:400; margin: 0.2rem 0;'>Total Deaths: <b>{%total_deaths}{groupsSeparator:\\,}</b></h6>");

    // configure the chart stroke
    chart.normal().stroke("#fff", 0.2);
    // set the point fill
    chart.fill(function (d) {
      return anychart.color.darken(this.parentColor, 0.15);
    });

    // set the chart container element id
    chart.container('container');
    // initiate chart drawing
    chart.draw();

  });
});
</script>
</body>
</html>
Conclusion
As you can see, this current period is difficult but building a JavaScript Sunburst Chart is not!
By the way, I was also thinking of changing the way the last-level labels are positioned, from radial (default) to circular. But I decided to not do that. If you’d like to give it a try, just add the following one line somewhere in the JS chart code:
chart.level(2).labels().position('circular');Don’t stop learning. Go on and use your newly acquired skill to create a JavaScript Sunburst Chart visualizing some other interesting hierarchical dataset. If you have any questions, I’ll gladly do my best to be of help.
Also, till the global situation improves, stay safe!
Published with permission of Shachee Swadia. Originally appeared on Towards Data Science under the title “How I Created a Sunburst Chart Using JavaScript to Visualize Covid-19 Data: A step-by-step tutorial on building interactive JS sunburst charts with ease” on December 3, 2020.
Check out other JavaScript charting tutorials.
- Categories: AnyChart Charting Component, Big Data, Business Intelligence, HTML5, JavaScript, JavaScript Chart Tutorials, Tips and Tricks
- No Comments »