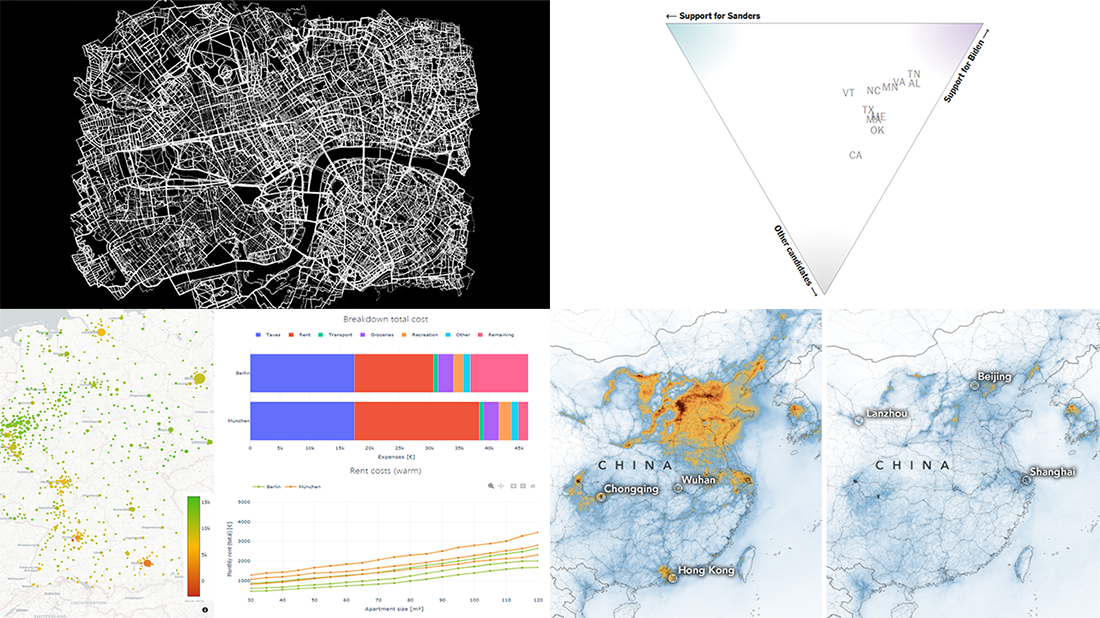
 Today is Friday. We have already chosen four new stunning visualization examples and are excited to show you them! Look how powerful the right charts and maps can be when you need to explore and communicate data. Here’s a quick list of the fresh visualization projects this new DataViz Weekly blog post puts a spotlight on:
- Takeaways from Super Tuesday — The New York Times
- Cost of living in German cities — Fabian Nobis
- Cycling all streets in central London — Davis Vilums
- Nitrogen dioxide over China and Wuhan — NASA Earth Observatory
Data Visualization Weekly with Fresh Visualization Projects: February 28, 2020 — March 6, 2020
Takeaways from Super Tuesday
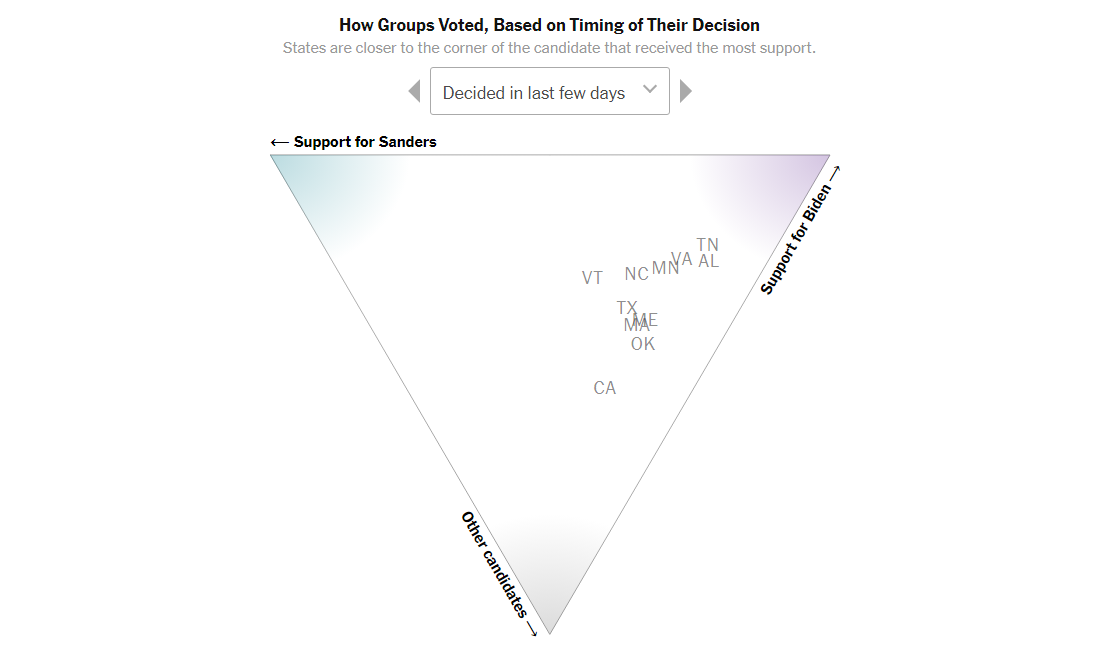 Super Tuesday, the biggest day of presidential primary voting, made it clear that the Democratic race is now a contest of Bernie Sanders and Joe Biden only. The two men were on pace to win the lion’s share of delegates. Michael Bloomberg, who spent hundreds of millions of dollars flooding the country with ads, achieved only one victory, in American Samoa, and suspended his campaign. Elizabeth Warren underperformed quite badly as well.
These are the results. What about takeaways? The New York Times came up with five. See what happened on Super Tuesday that changed the Democratic race and what it all means — in bar charts, ternary plots, and maps.
Cost of Living in German Cities
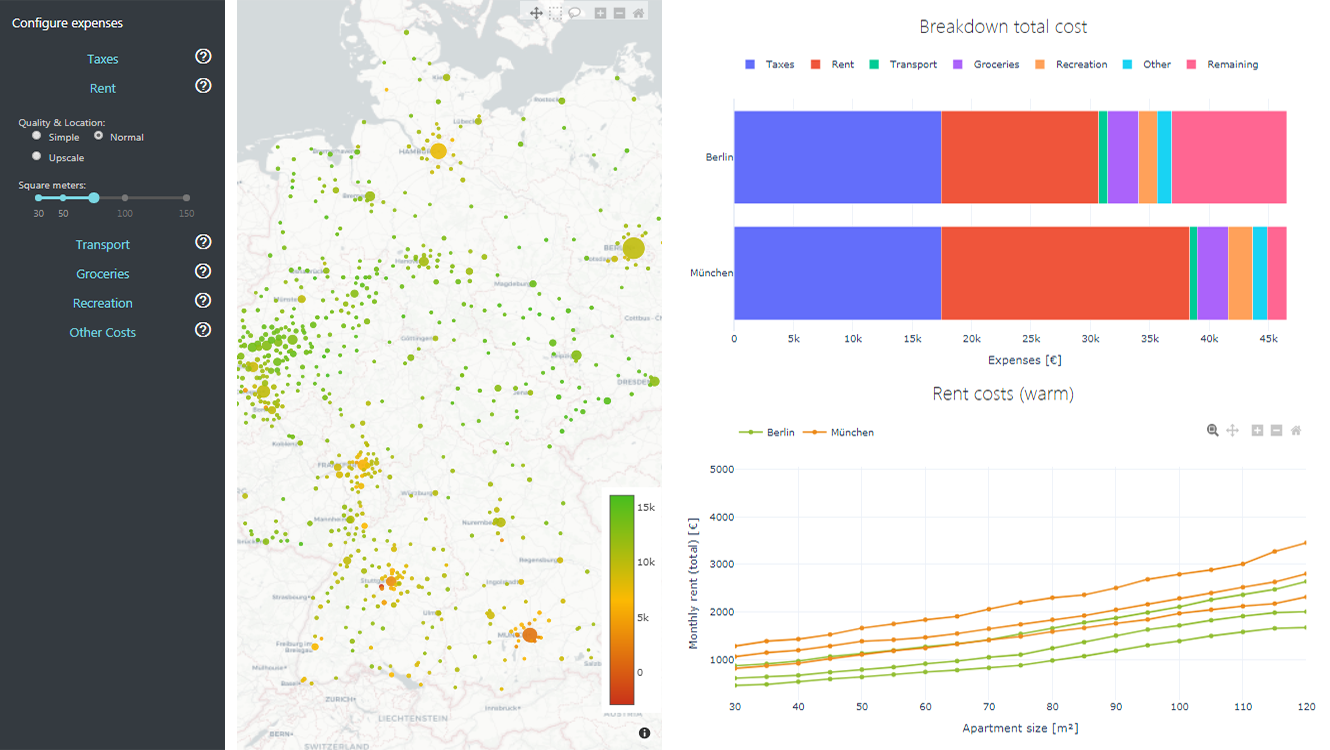 Exploring cost-of-living data can often be fun. It is especially so when you take a look at such statistics from an interesting perspective. Fabian Nobis, a data scientist from Dresden, did that thinking about moving to different cities. To avoid annoying calculations of whether or not he can afford to live in one city or another, he created an awesome tool which shows the answer at a glance once you enter some details on your personal financial situation.
Compare the cost of living across Germany and see in what cities you can and cannot afford to move to. Then, for example, pretend to be a German and see if something changes: According to the Federal Statistical Office of Germany, the average gross annual salary in the country was 46,560 euros (or 3,880 euros per month) in 2018; individual salaries can vary greatly, though, of course.
Cycling All Streets in Central London
Exactly 5 years ago I started my journey to visit every single street in central London. This is how London’s grid emerges, using only my cycling journeys.
Here’s a little story, how I did it.https://t.co/VwnjnLz832 pic.twitter.com/kGMwp2tqz5— Dāvis Viļums (@DavisVilums) February 23, 2020
Programmer Davis Vilums, a passionate cyclist, got bored over time with his daily 25-minute ride to work. Then he became obsessed with an idea to try every different route (and never be late for work). So he cycled through all the streets in central London and mapped his travels.
Check out his cool cycling story with visual maps in pictures and animations. Loved it. Overall, it took Davis four years to visit every single road on his map of central London.
Nitrogen Dioxide Over China and Wuhan
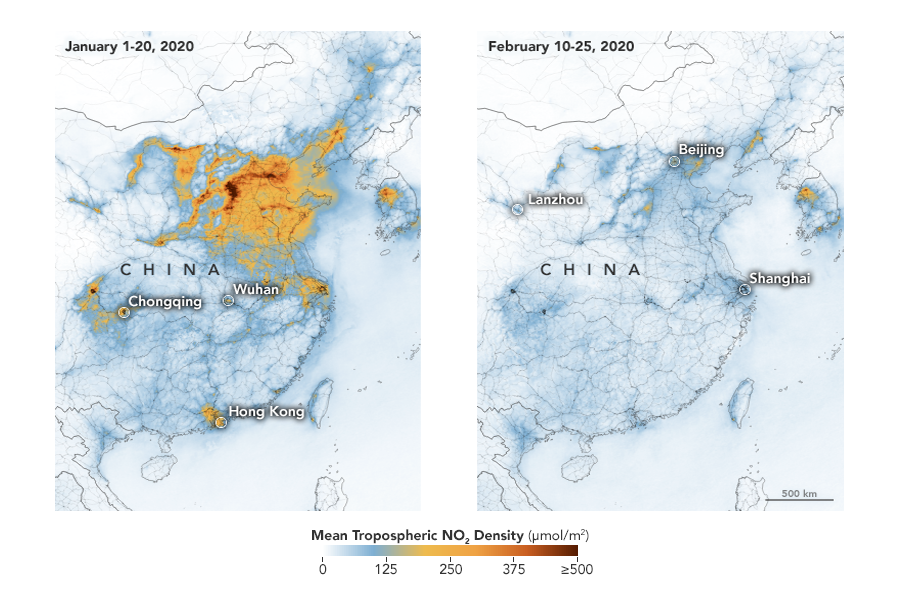 Air pollution monitoring satellites of the European Space Agency (ESA) and the U.S. National Aeronautics and Space Administration (NASA) identified significant decreases in the levels of nitrogen dioxide (NO2) over China. NASA Earth Observatory published maps that visualize the January and February data about the tropospheric NO2 density. It may well be a consequence of the economic slowdown caused by the Wuhan coronavirus outbreak, experts say.
Compare how the sky above China looked in terms of the mean amounts of nitrogen dioxide in the troposphere in January 1-20 and February 10-25. Do not miss out on similar maps zooming in to the Wuhan area. They show a drop that took place with the coronavirus quarantine, and what’s also important, reveal that NO2 levels did not rise after the Chinese New Year as they had done in 2019.
***
Stay tuned for fresh visualization projects in Data Visualization Weekly. See you in a week.
Meanwhile, have a wonderful weekend time!
- Categories: Data Visualization Weekly
- No Comments »