 Hey, check out some more of the new awesome data projects we’ve come across this week! It’s a new DataViz Weekly article, and today we are glad to show you cool charts and maps visualizing costs and fires:
- Salaries adjusted for cost of living across the United States
- U.S.-China trade war costs for American families
- Affordable home rentals in California
- Long-term record of fires worldwide
Charts and Maps Visualizing Costs and Fires, in Data Visualization Weekly: August 30, 2019 – September 6, 2019
Salaries Adjusted for Cost of Living Across U.S.
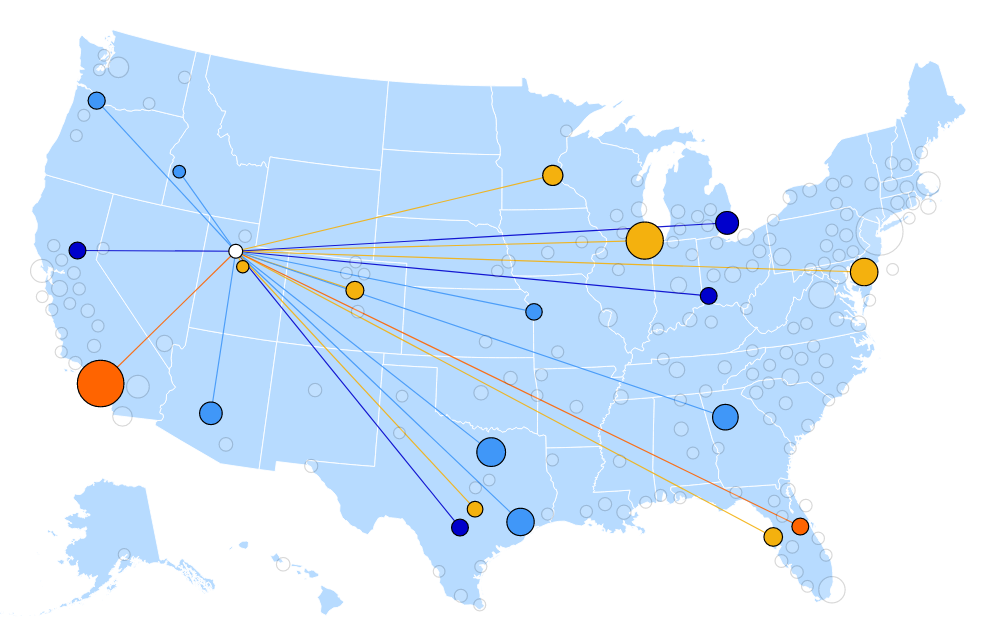
Salaries are known to be higher in big cities. But what about cost of living? In fact, the price of housing, physical goods, and various services is different from area to area.
Analysts from Indeed, a leading job search engine, adjusted salary data (from job postings) for local disparities across the United States (according to statistics from the U.S. Bureau of Economic Analysis) to see a more real-world picture. According to the results of their research, salaries in smaller places are generally higher than in bigger metropolitan areas after accounting for the cost of living.
While such a conclusion alone may well be unsurprising to many people, it is still interesting to look at the details. Use Indeed’s interactive data visualization tool to compare the adjusted salaries across the country, and learn more in the article.
Trade War Costs for American Families
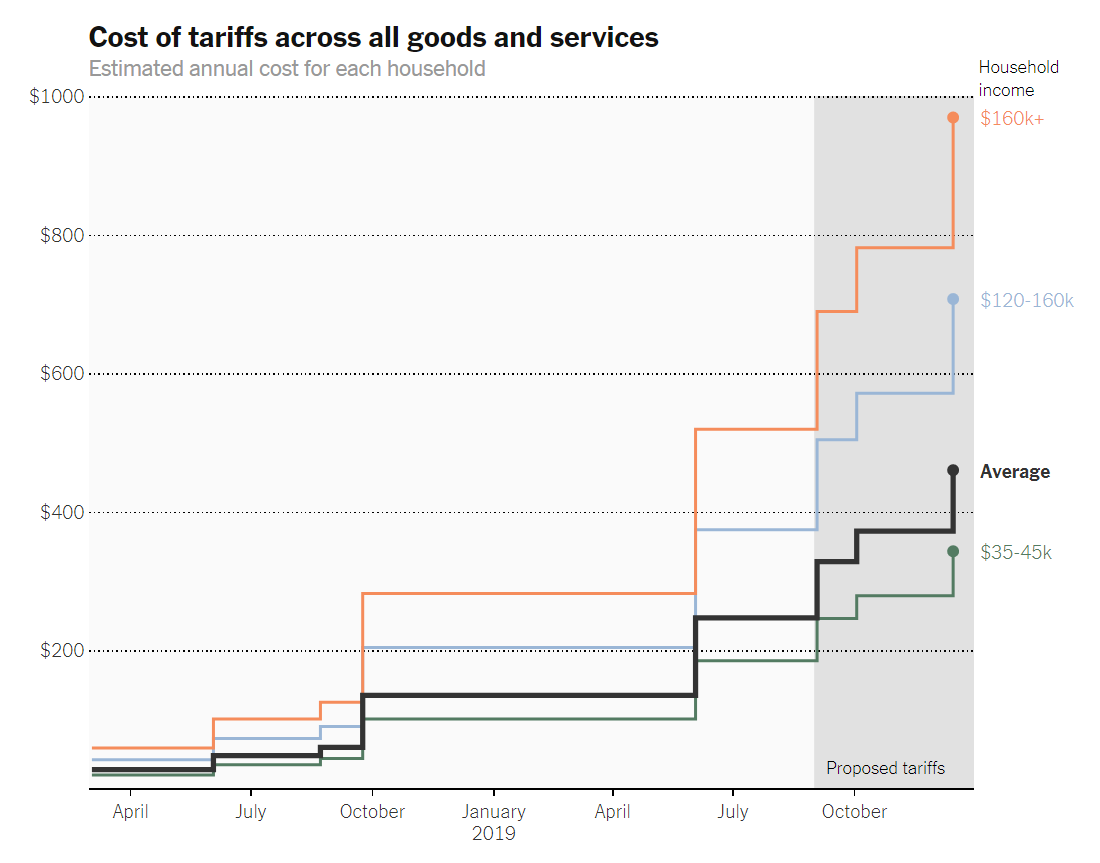
Continuing to consider the cost of living in the United States, we could not miss a new analysis of possible consequences of the trade war between America and China for regular people. According to London economists Kirill Borusyak and Xavier Jaravel, new tariffs imposed by the Donald Trump administration will cost the average American family another $460 over a year, ranging from $340 for the country’s poorest households to $970 for its wealthiest.
Check out the data presented in a few telling charts and read more on The New York Times.
Affordable Rentals in California
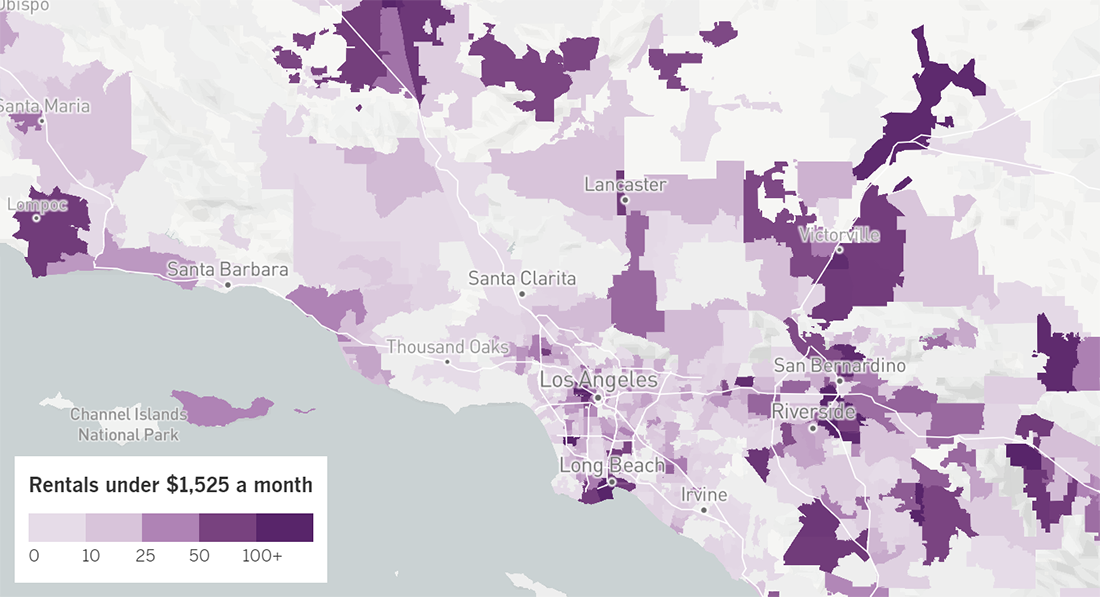
Now we invite you to look at rental costs. The Los Angeles Times visualized data from Zillow, an American real estate marketplace, to provide insight into the current state of California’s rental market. They made it in the form of an interactive tool that allows you to see where in California you can afford to rent a place based on how much money you make.
Enter your salary and explore the map you’ll get to find out rentals in what areas are available in the corresponding price range.
Long-Term Record of Fire Worldwide
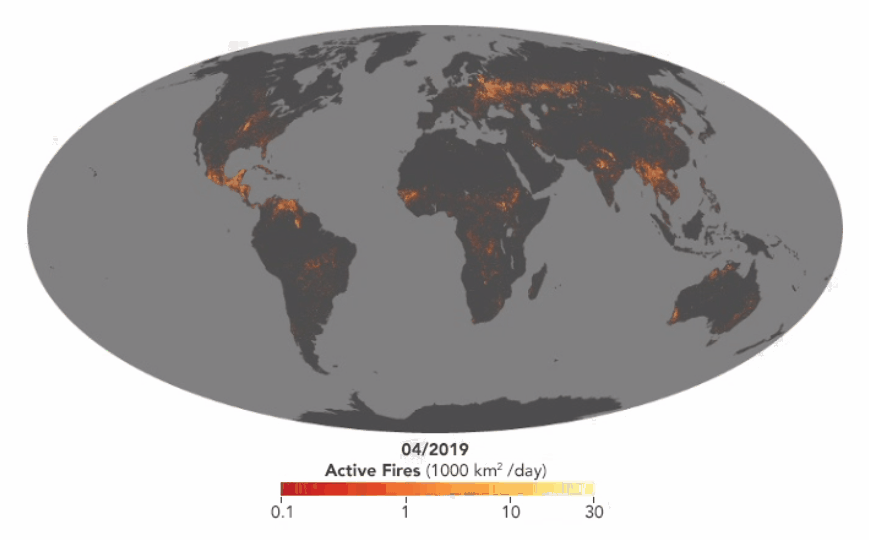
NASA published an impressive world map-based animation that shows “the locations of actively burning fires on a monthly basis for nearly two decades,” between 2000 and just about now. It visualizes fire monitoring data recorded by the Moderate Resolution Imaging Spectroradiometer (MODIS) installed on NASA’s Terra satellite, coloring every thirty fires in a 1,000-square-km area per day in white, ten fires in orange, and one fire in red.
Explore how fires around the world have been changing. Don’t miss out on a few other visualizations provided in Adam Voiland’s article on the website of NASA’s Earth Observatory, including a chart that reveals a declining trend in the global burned area in 2003-2015 (additionally, the total number of square kilometers burned each year is reported to have dropped by about 25% between 2003 and 2019).
***
Everyone, thank you so much for your attention to Data Visualization Weekly and AnyChart Blog. We hope you liked these data projects with charts and maps visualizing costs and fires. We’ll be back with another dose of interesting data visualizations next Friday. Stay tuned.
- Categories: Data Visualization Weekly
- No Comments »