 Enjoy our new selection of cool visual statistics projects that have been recently created around the web. These are worth seeing and we are glad to feature them on DataViz Weekly:
- All eight Fast & Furious movies in data
- Worldwide internet users statistics by region
- Economic and other indicators across 401 districts of Afghanistan
- Satellites imaging our Earth every day
Visual Statistics in Data Visualization Weekly: July 26, 2019 — August 2, 2019
Fast & Furious Statistics
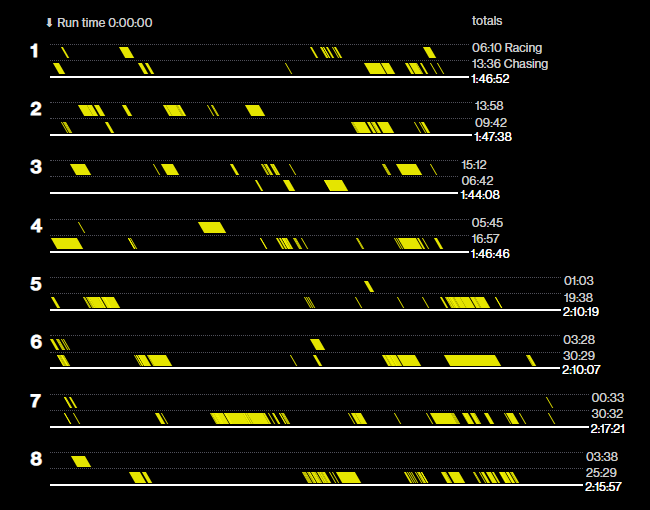
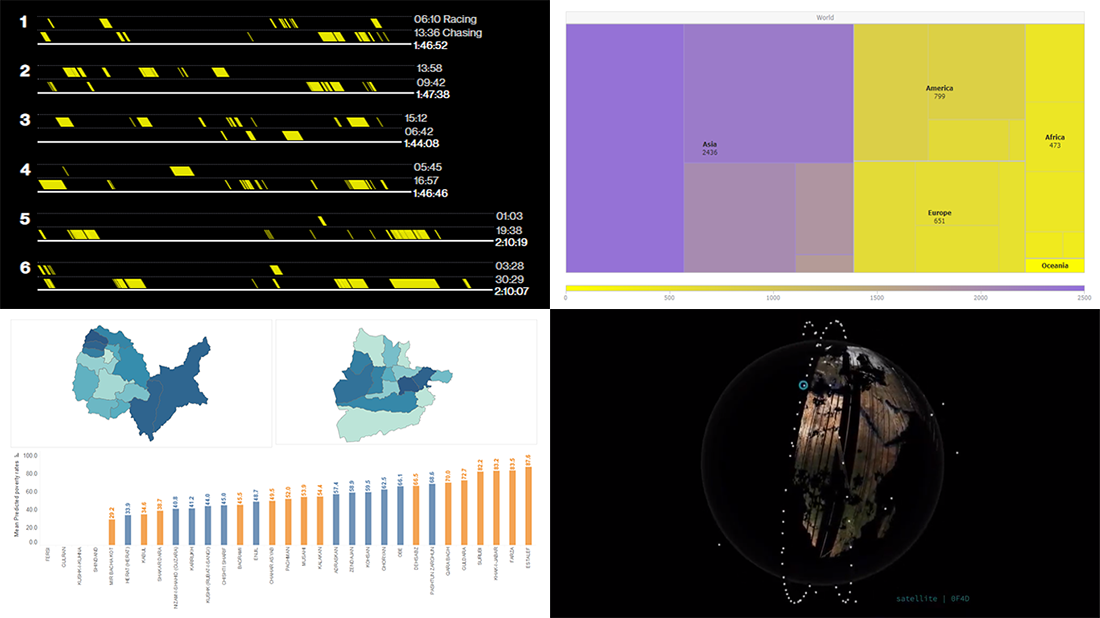
“Hobbs & Shaw,” the first-ever official “Fast & Furious” spinoff, was theatrically released in the United States earlier today, August 2. Before it hit American theaters, Bloomberg had scrupulously analyzed all eight movies of the main series in order to monitor how they had evolved. According to the authors, they’d “counted just about everything that could be turned into a meaningful metric to find out who inflicts the most pain and kicks the most ass.”
Take a look at yesterday’s cool visual story on Bloomberg with plenty of interesting statistics and charts showing the number of hugs, Corona sips, punches, smiles, minutes spent racing, and many other things changing from movie to movie.
Internet Users Worldwide by Region

In celebration of World Wide Web Day, programming student Doug Baxter developed an interactive treemap chart that shows the number of internet users around the world by region, based on data for January 2019 available on Statista. He also used it as the main example being built along his tutorial on how to create a treemap chart using JavaScript published yesterday on our blog as a guest post.
Check out the interactive version of the treemap — it’s available on AnyChart Playground, and you can also open it in the online code editor if you want to look into and play with its HTML/CSS/JavaScript code.
Afghanistan Dashboard
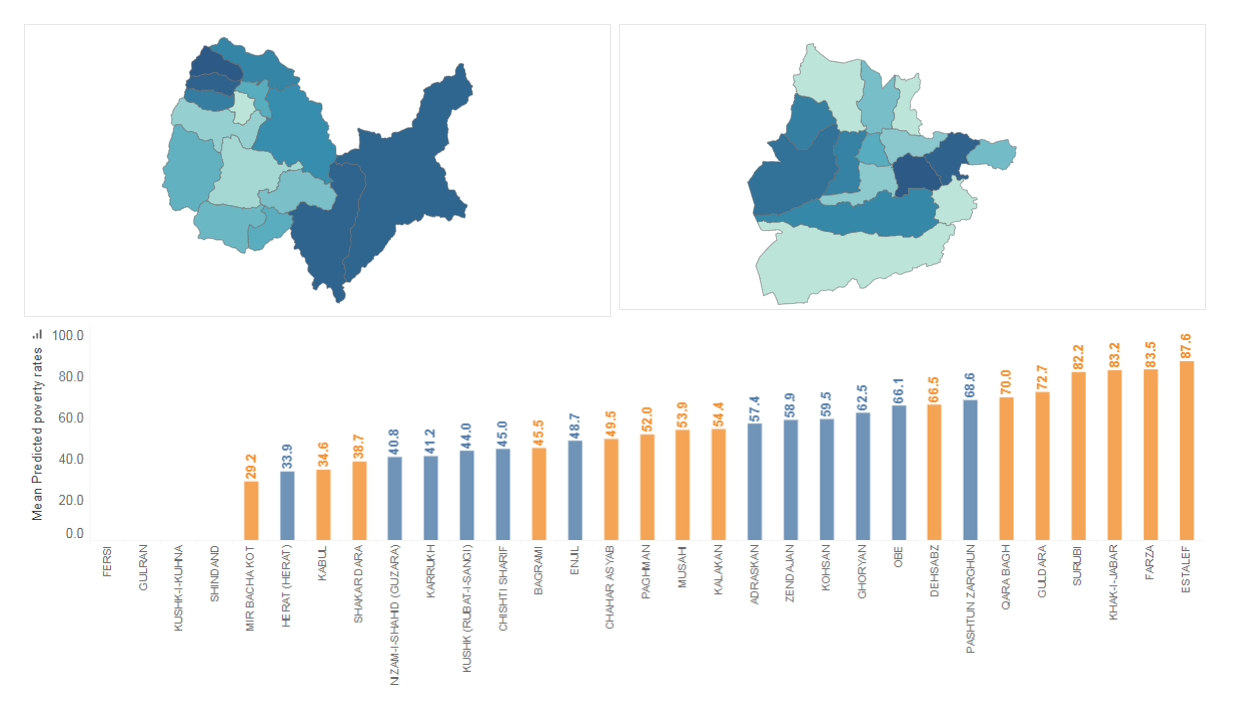
The World Bank published an interactive dashboard that visualizes 53 social, economic, and geographic indicators across 401 districts in Afghanistan, according to 2016 data from public and private sources. The project also includes a province-level time-series visualization that displays socio-economic trends for 34 provinces between 2007 and 2016.
Visit Afghanistan: District Dashboard to learn more about what’s going on within this country, in maps and charts.
Satellites Imaging Earth Every Day
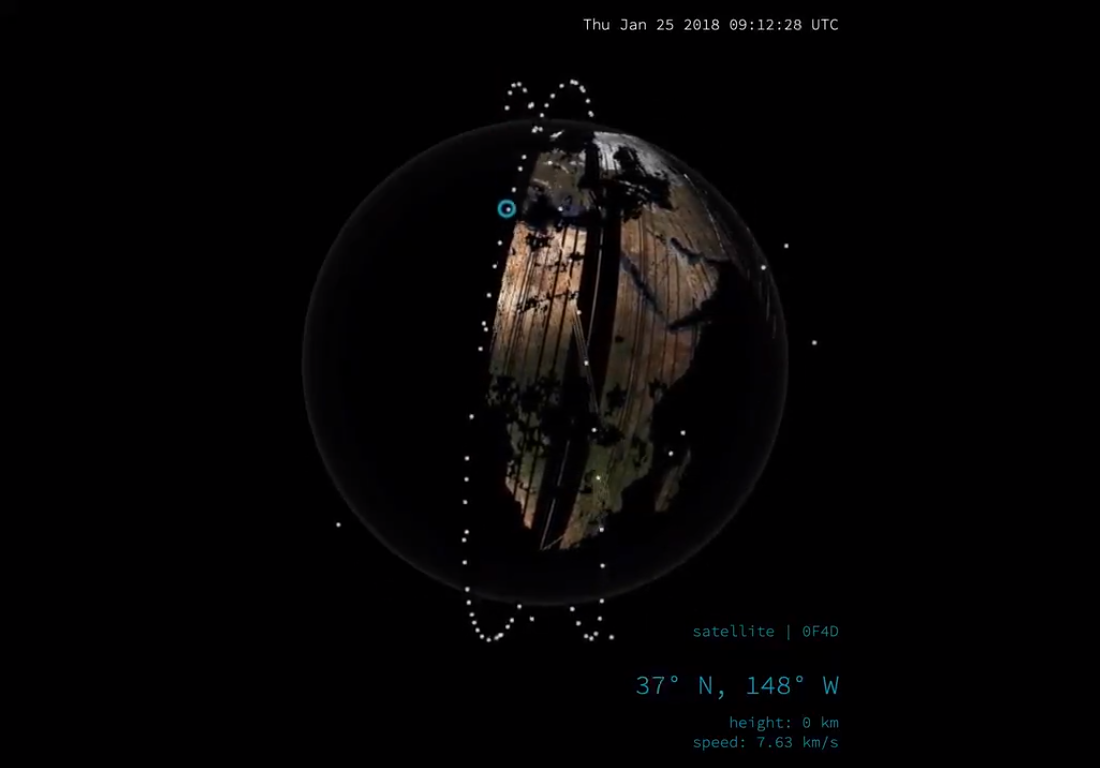
Data visualization designer Nadieh Bremer made another awesome visualization. Commissioned by Planet, a private Earth imaging company based in California, her new project shows how Planet’s army of more than 150 satellites currently in orbit are creating an image of the entire Earth during one single day.
Look how they move and how the photos they capture slowly build up our planet. Don’t miss out on watching the blue circle following a random satellite during every several seconds, accompanied by the information about its location, height, and speed.
***
Thanks for your attention. Have a great weekend time. We’ll show you more examples of new cool visual statistics next Friday.
- Categories: Data Visualization Weekly
- No Comments »