 It’s Friday, and we have a pleasure to show you another four new awesome data visualizations we’ve been delighted to check out these days. Look what’s presented on DataViz Weekly this time:
- NBA players’ shot improvement
- Population trends in Europe
- The most-assigned texts from college syllabi worldwide
- The most popular NFL teams and players in every county of the United States
Awesome Data Visualizations in Data Visualization Weekly: July 19, 2019 — July 26, 2019
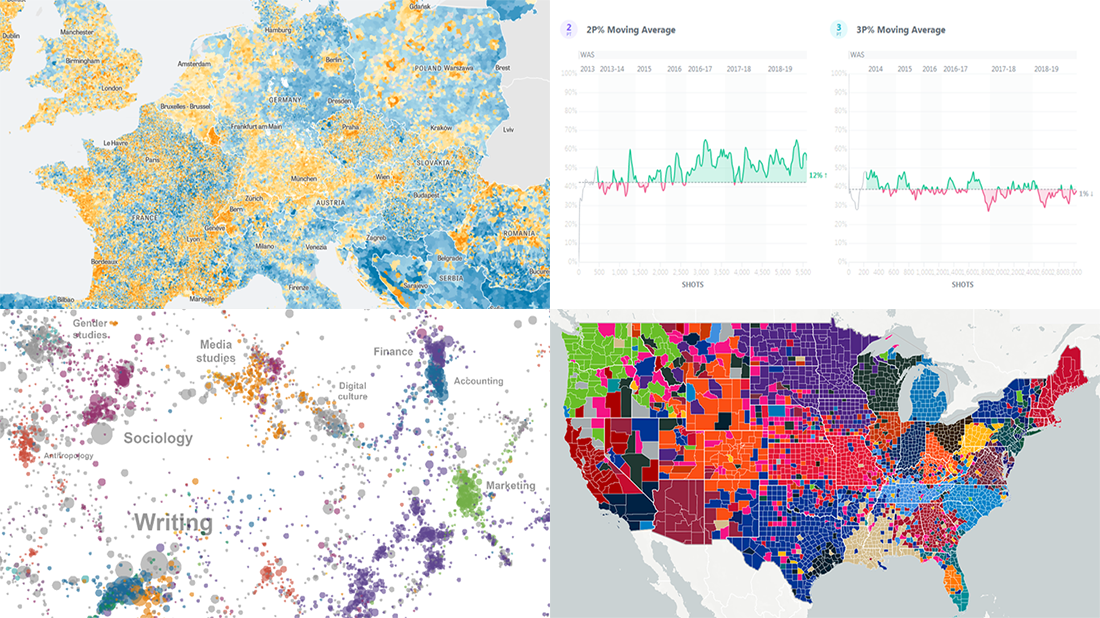
NBA Players’ Shot Improvement
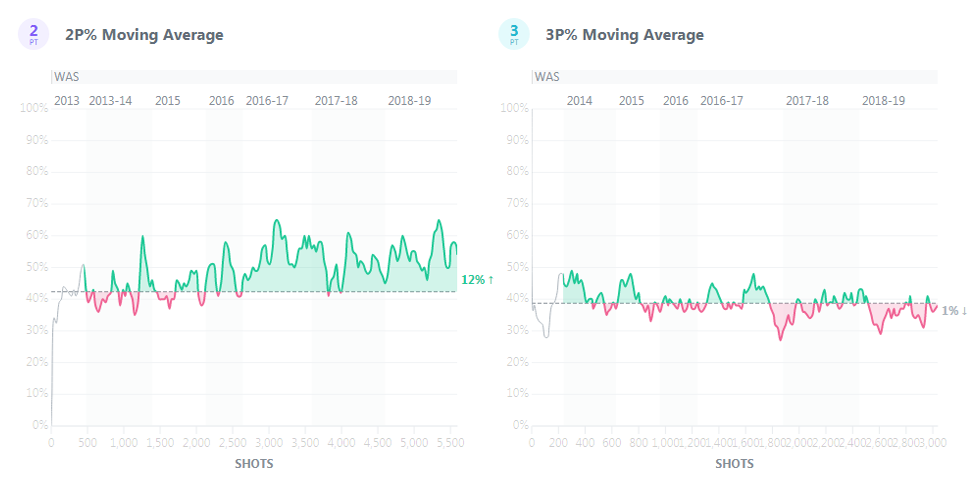
Data visualization and engineering expert Peter Beshai, currently Director of Engineering and Design at Cortico, launched a new cool basketball data visualization project, Shotline. It allows us to dive into the shot performance statistics of NBA players all the way back to the 2000-01 season to understand whether or not a player’s shot improved over time.
Click a players’ name to view summaries and moving averages for their two-point shots and three-pointers, as well as shooting distance proportions, in figures and charts.
Population Trends in Europe
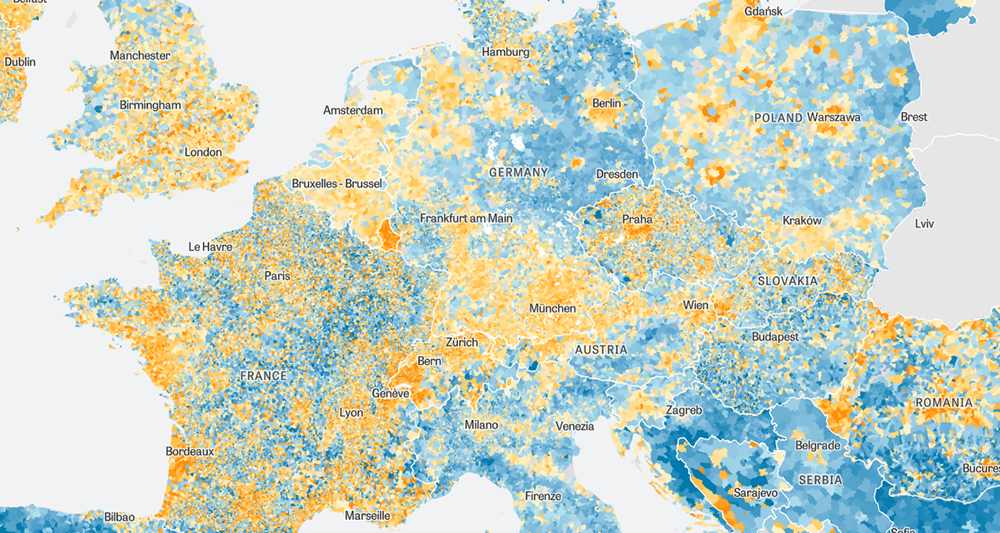
Zeit Onine’s Paul Blickle, Michael Schlieben, Julius Tröger and Sascha Venohr looked into the European demographics data to see what cities and regions tend to grow in terms of the number of inhabitants and where the population declines. For their analysis, they visualized statistics from Germany’s Federal Institute for Research on Building, Urban Affairs and Spatial Development (BBSR) for the period from 2011 to 2017, the most recent one reviewed by the institution.
Check out an interactive map published on Zeit Online to understand which areas across Europe gained and lost population over those seven years compared to preceding years.
Most-Assigned Texts from College Syllabi Worldwide
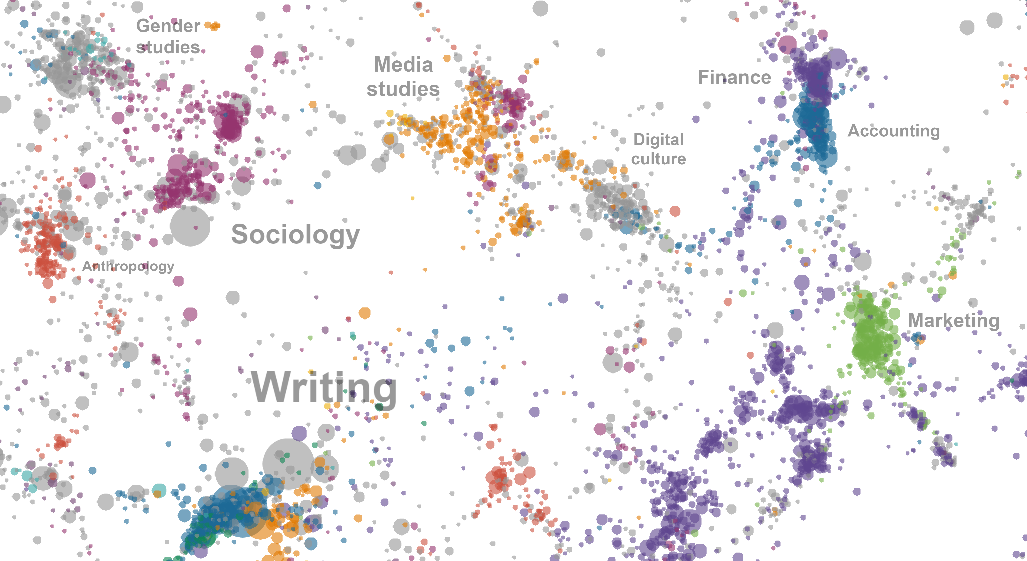
The American Assembly, an independent non-profit organization affiliated with Columbia University, updated the website of its Open Syllabus Project (OSP), which puts together and analyzes data about text assignments from college course syllabi around the world, by adding an interactive visualization. Created by MIT Media Lab’s graduate student David McClure under the title of ‘Co-Assignment Galaxy,’ the visualization represents the 164,720 books and articles most frequently assigned in college according to more than 6 million syllabi collected as of now.
Explore the OSP data visualization to find out what texts are currently most widespread in college syllabi, by discipline and overall.
Most Popular NFL Teams and Players in Every County
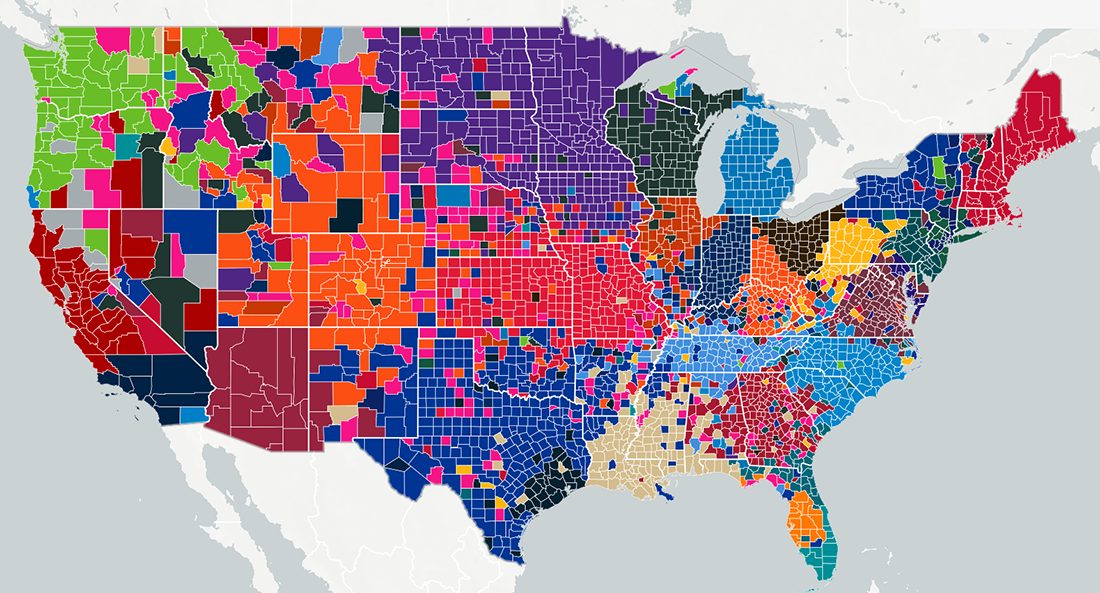
Vivid Seats, one of the largest online ticker resellers, in collaboration with opendorse, a social publishing platform helping athletes share content on social media, studied the popularity of American football teams and players across the United States. For the best visual representation of their own data, they made an interactive map.
Look at the map to find out what team and player in the NFL is most popular in every county and discover geographical patterns revealing regional trends and outliers.
***
Each week on Friday, we show you some of the most awesome data visualizations we’ve come across around the web. Stay tuned and don’t miss out on the next Data Visualization Weekly post on the AnyChart blog in seven days.
Have a great time!
- Categories: Data Visualization Weekly
- No Comments »